Open Access
Fig. 4
Download original image
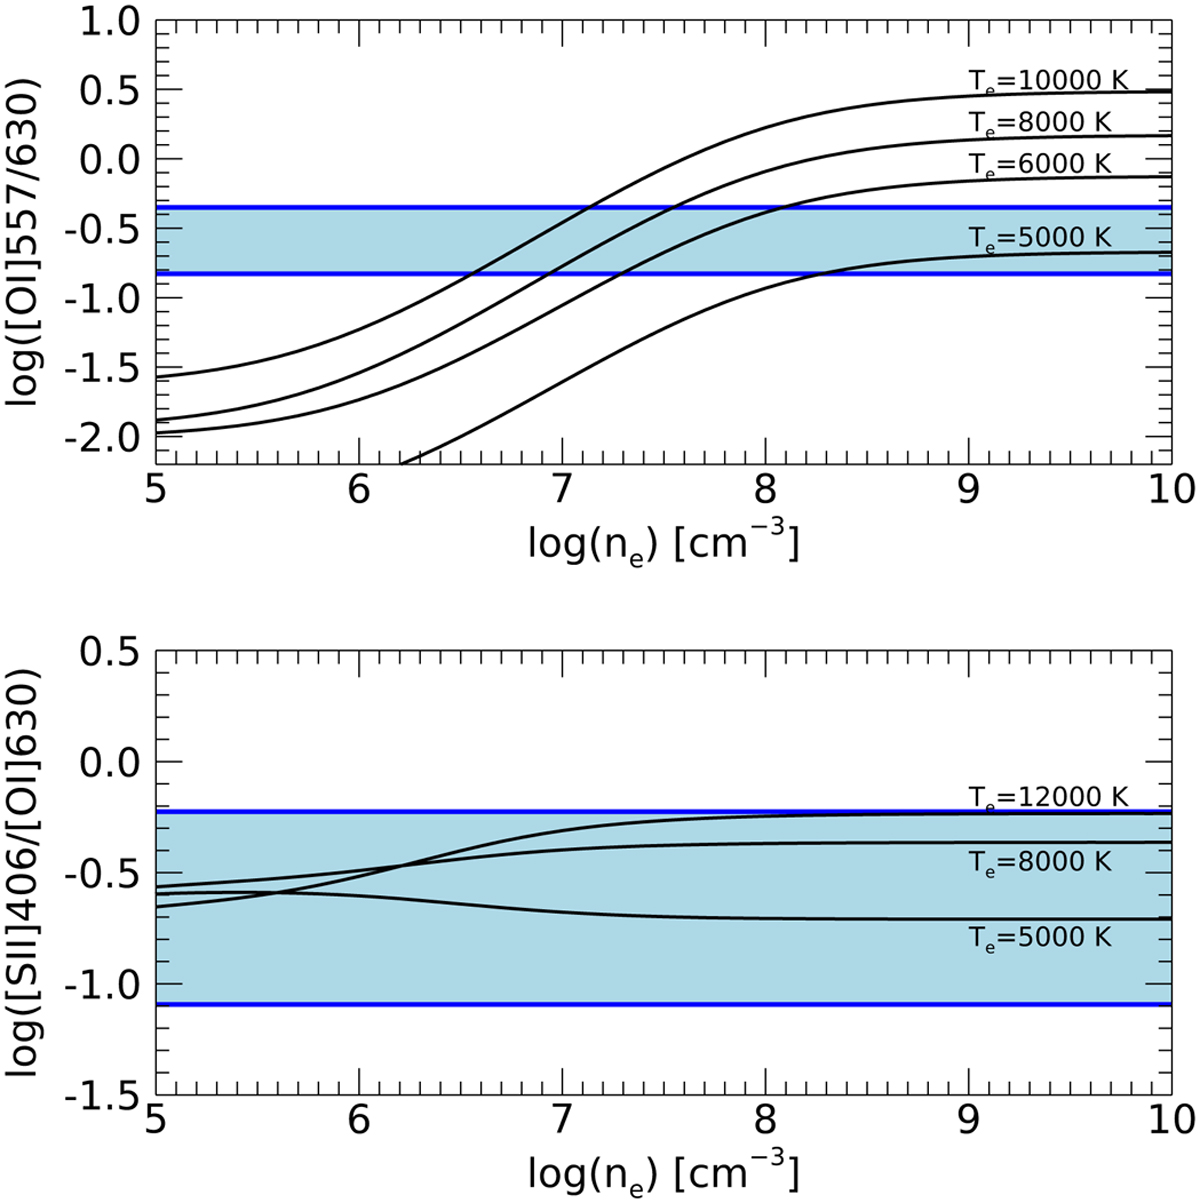
Diagnostic diagrams of line luminosity ratios due to thermal excitation as a function of density and temperature as computed by Giannini et al. (2019). Solar abundance was assumed for all involved species. Blue regions indicate the range of values measured in this work for the LVCs.
Current usage metrics show cumulative count of Article Views (full-text article views including HTML views, PDF and ePub downloads, according to the available data) and Abstracts Views on Vision4Press platform.
Data correspond to usage on the plateform after 2015. The current usage metrics is available 48-96 hours after online publication and is updated daily on week days.
Initial download of the metrics may take a while.