Fig. 2
Download original image
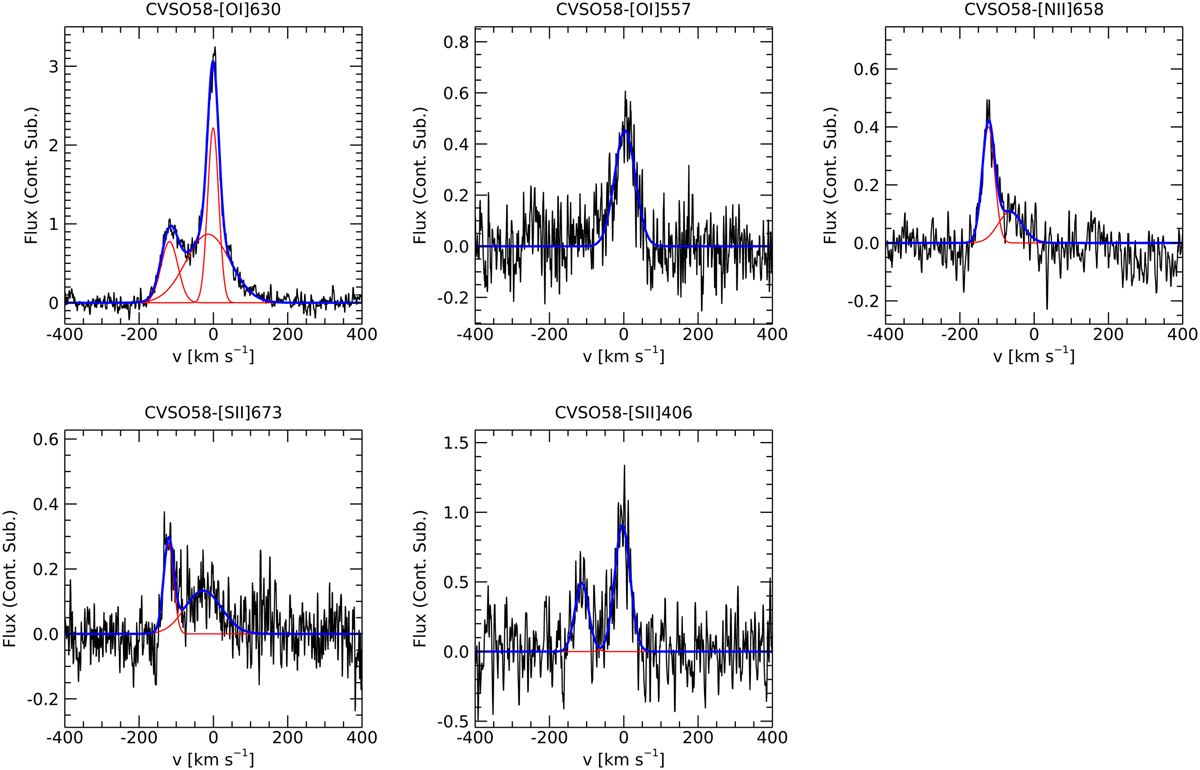
Example of Gaussian decomposition. The continuum-subtracted forbidden line profiles are shown with black lines. In blue, we have plotted the fit to the profile, while individual components are shown with red lines. Flux units are 10−15 erg−1 cm−2 Å−1. For each panel, the target name and line diagnostics are indicated. The complete sample is reported in Fig. A.1.
Current usage metrics show cumulative count of Article Views (full-text article views including HTML views, PDF and ePub downloads, according to the available data) and Abstracts Views on Vision4Press platform.
Data correspond to usage on the plateform after 2015. The current usage metrics is available 48-96 hours after online publication and is updated daily on week days.
Initial download of the metrics may take a while.