Fig. 8
Download original image
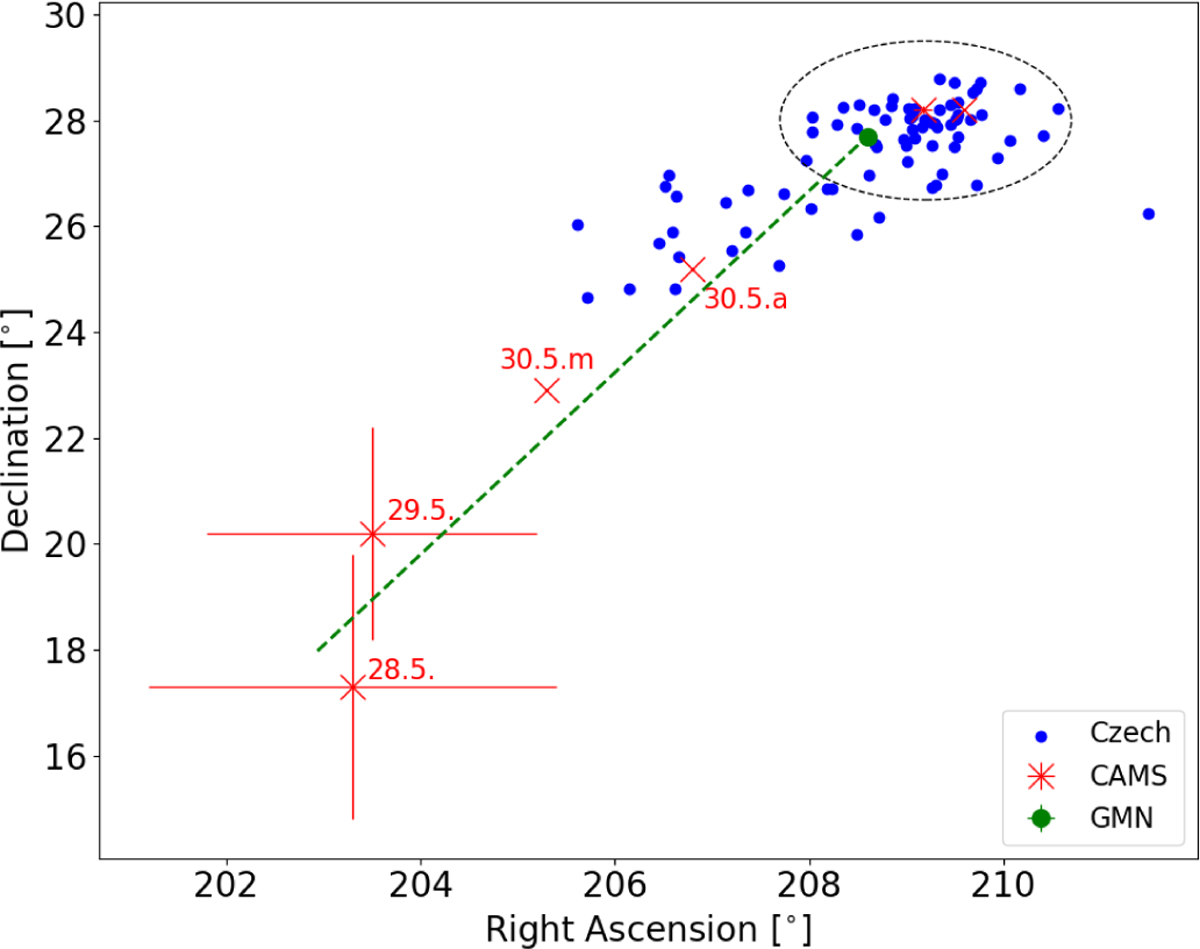
Comparison of τ Herculid geocentric radiants observed by this experiment (blue circles), by the CAMS network (the red crosses represent the daily mean radiants), and the GMN network (the green circle represents the mean peak radiant). The CAMS daily mean positions are additionally annotated with the date (m = morning, and a = afternoon). The two positions without any annotation represent the evening and morning positions of the main peak night. Moreover, the radiant shift as recorded by the GMN is plotted for the last two days before the maximum (green dashed line).
Current usage metrics show cumulative count of Article Views (full-text article views including HTML views, PDF and ePub downloads, according to the available data) and Abstracts Views on Vision4Press platform.
Data correspond to usage on the plateform after 2015. The current usage metrics is available 48-96 hours after online publication and is updated daily on week days.
Initial download of the metrics may take a while.