Open Access
Fig. 4
Download original image
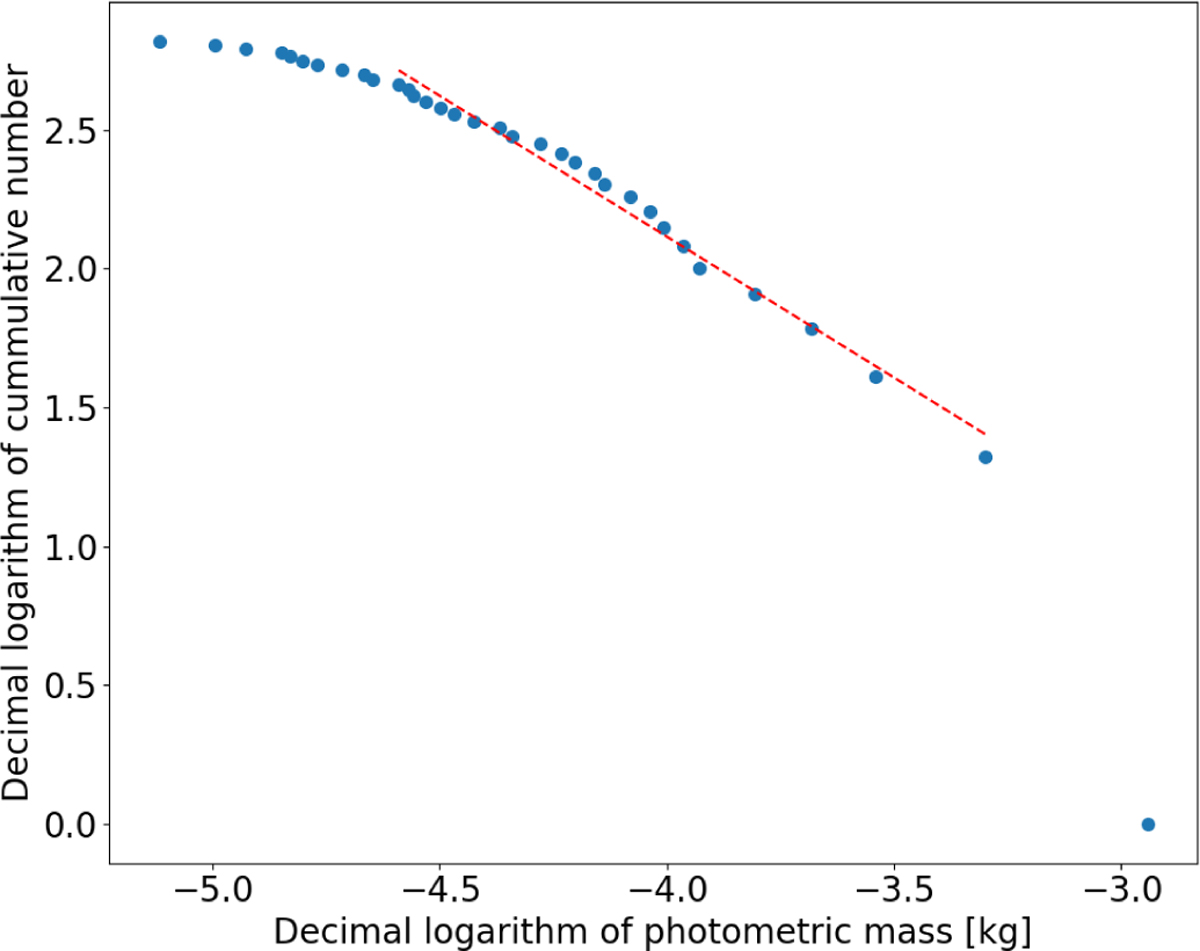
Cumulative distribution of τ Herculid meteors recorded by the DMK and Maia cameras. The red line shows the fit of a linear part of the plot. The measured slope of the fit k = −1.02 is used to calculate the mass distribution index. Each point represents the mean value for 20 meteors.
Current usage metrics show cumulative count of Article Views (full-text article views including HTML views, PDF and ePub downloads, according to the available data) and Abstracts Views on Vision4Press platform.
Data correspond to usage on the plateform after 2015. The current usage metrics is available 48-96 hours after online publication and is updated daily on week days.
Initial download of the metrics may take a while.