Fig. 7.
Download original image
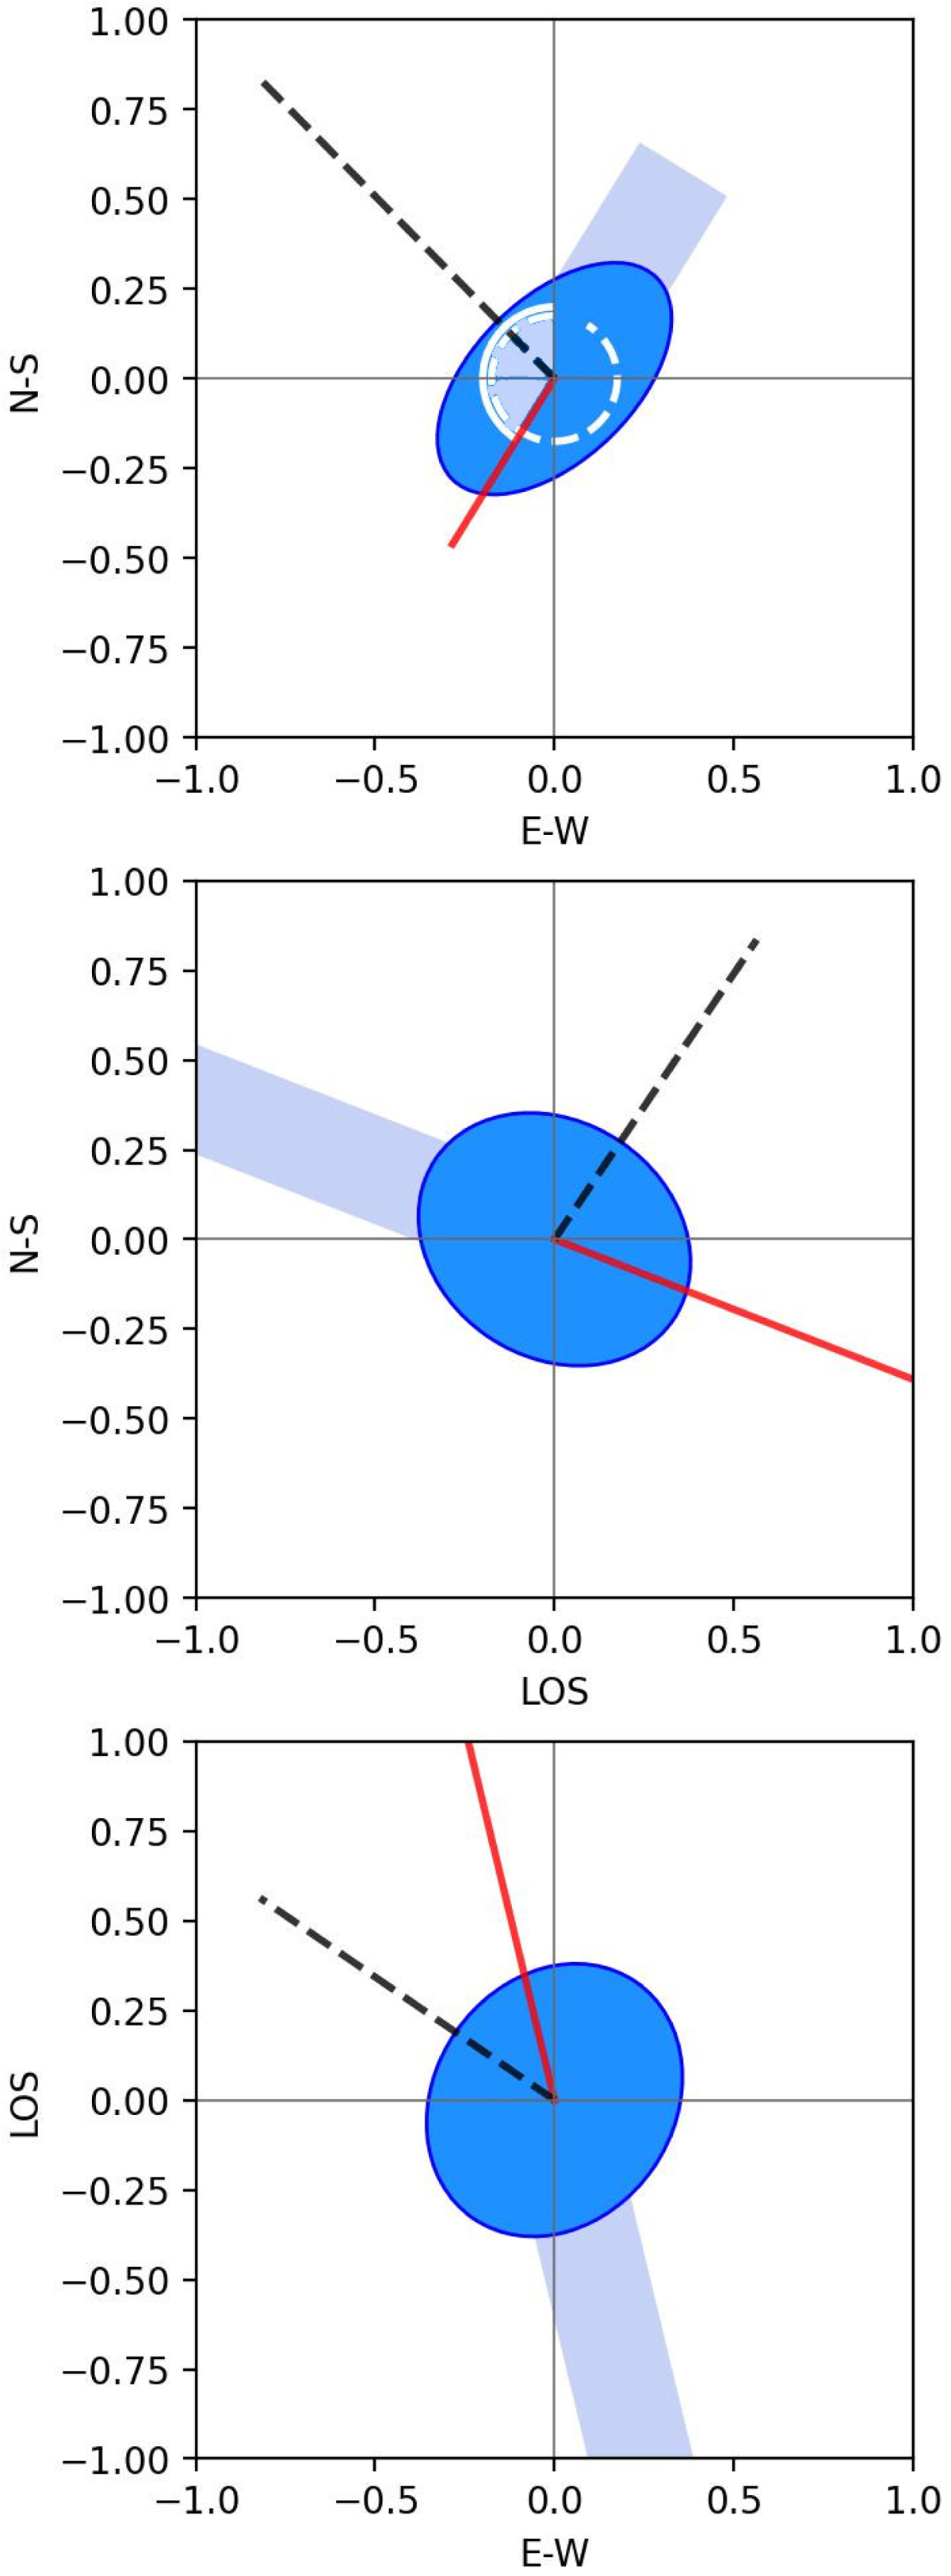
Example of the 3D projections in the cartesian system for galaxy #1. The blue disk and segment represent the stellar disk and the observed radio tail. The red and black vectors are, respectively, the projections of ![]() and
and ![]() . From top to bottom: projection along the LOS (which corresponds to the observed projection), along the E–W axis, and along the N–S axis. In the top panel, we show the θV (white, filled) and the θtail (white, dashed) angles.
. From top to bottom: projection along the LOS (which corresponds to the observed projection), along the E–W axis, and along the N–S axis. In the top panel, we show the θV (white, filled) and the θtail (white, dashed) angles.
Current usage metrics show cumulative count of Article Views (full-text article views including HTML views, PDF and ePub downloads, according to the available data) and Abstracts Views on Vision4Press platform.
Data correspond to usage on the plateform after 2015. The current usage metrics is available 48-96 hours after online publication and is updated daily on week days.
Initial download of the metrics may take a while.