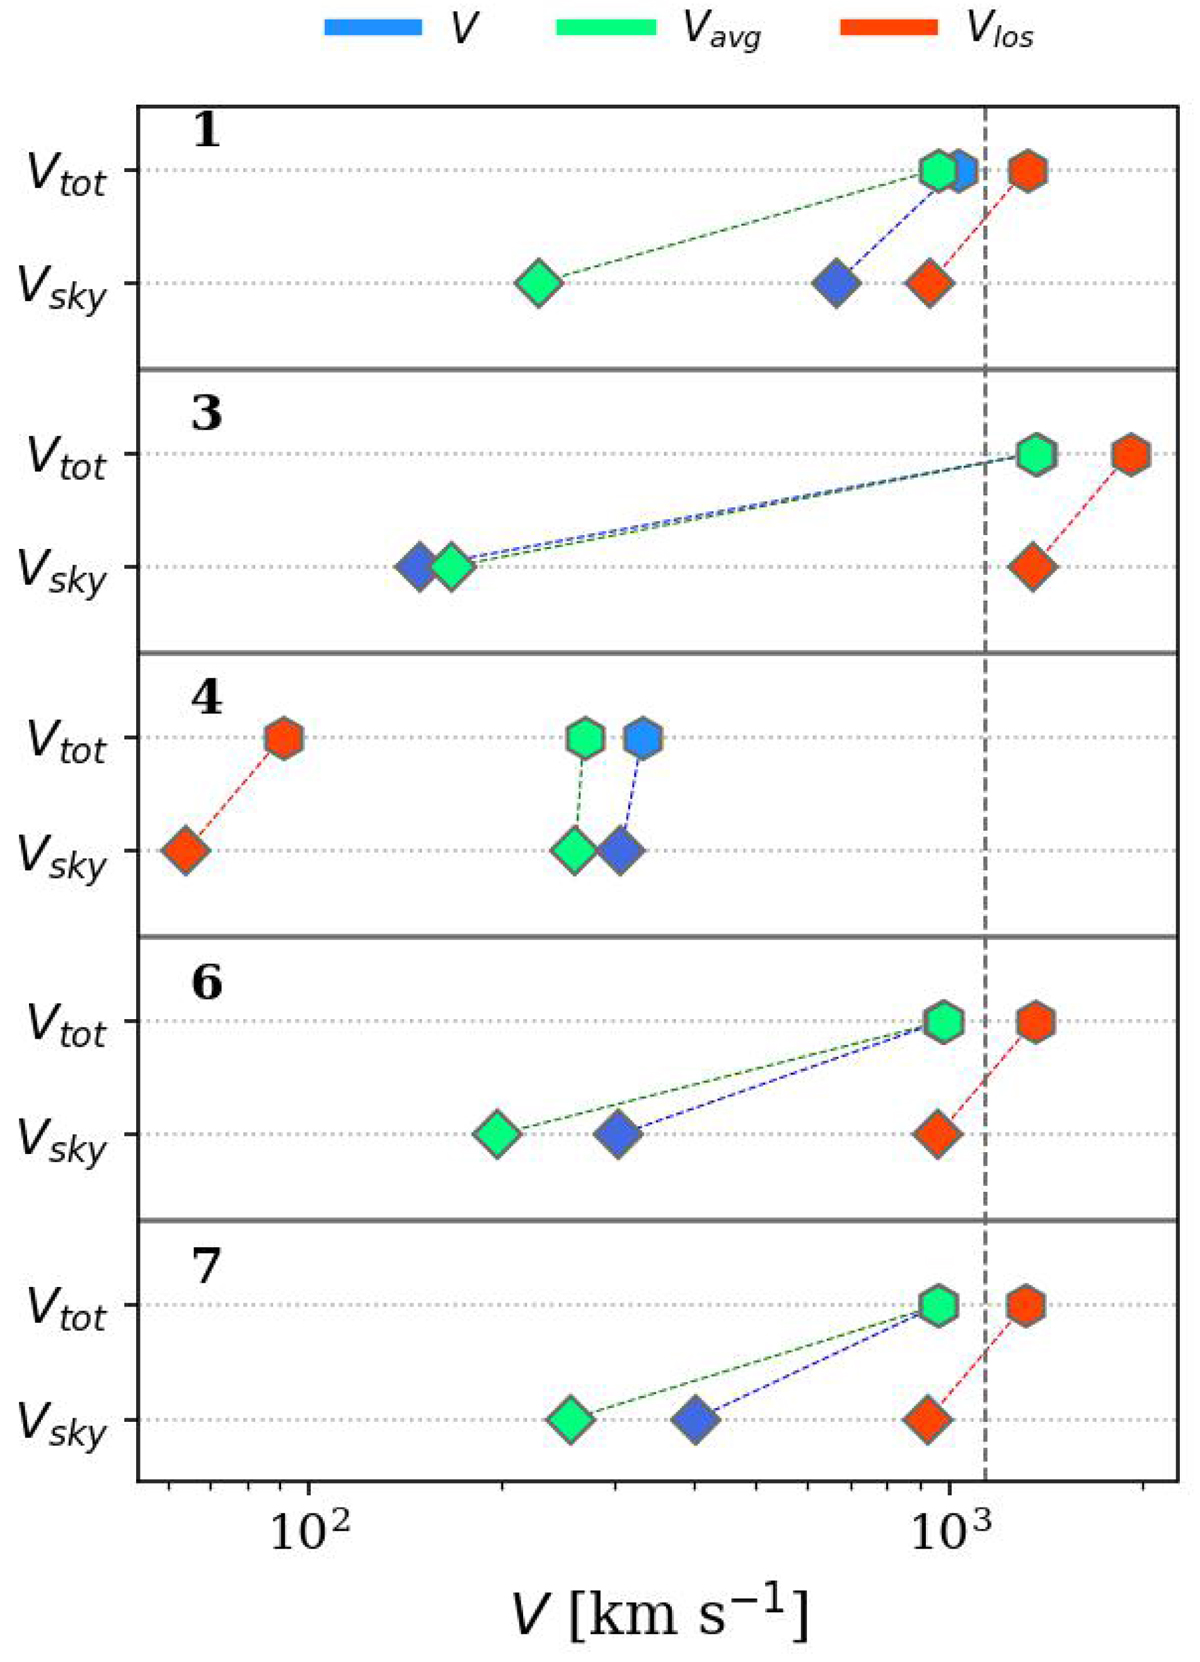
Fig. 5.
Download original image
Comparison between the vsky derived with three different methods for each of the galaxies of our sample (lower row, diamonds) and the corresponding total velocities (upper row, hexagons), connected by the dashed lines. The three methods are: the best-fit velocity V derived from the 400 MHz profile (blue), vsky = vlos (red), and vsky = vavg (green). The vertical dashed line shows the value of σcl.
Current usage metrics show cumulative count of Article Views (full-text article views including HTML views, PDF and ePub downloads, according to the available data) and Abstracts Views on Vision4Press platform.
Data correspond to usage on the plateform after 2015. The current usage metrics is available 48-96 hours after online publication and is updated daily on week days.
Initial download of the metrics may take a while.