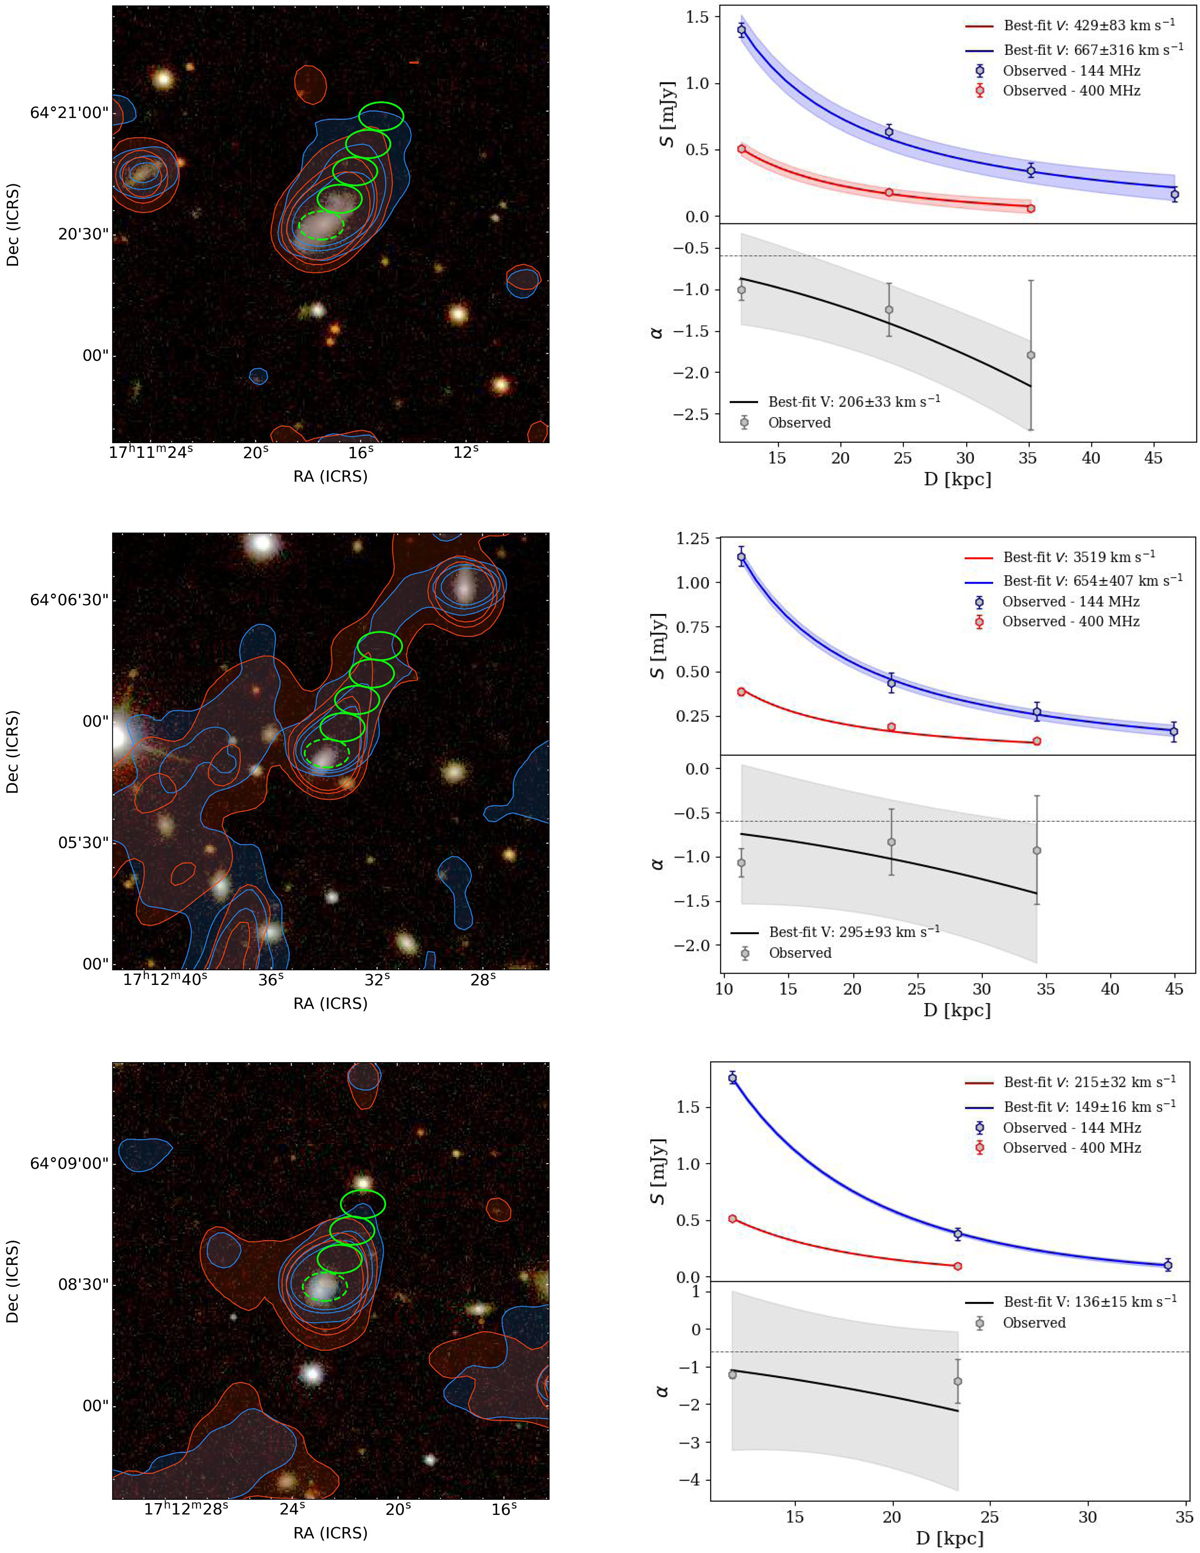
Fig. 3.
Download original image
Velocity fits for galaxies #1, #2, and #3 (from top to bottom). Left: SDSS RGB image overlapped with the 3, 9, 15×rms surface brightness contours at 144 (blue) and 400 MHz (orange) and the sampling regions (green ellipses). The dashed region marks the reference center of the galaxy. Right: flux density (top) and spectral index (bottom) trends with the distance from the stellar disk, and the corresponding best-fit profiles. The color-filled area indicates the 1σ confidence region. The horizontal dashed line indicates α = −0.6.
Current usage metrics show cumulative count of Article Views (full-text article views including HTML views, PDF and ePub downloads, according to the available data) and Abstracts Views on Vision4Press platform.
Data correspond to usage on the plateform after 2015. The current usage metrics is available 48-96 hours after online publication and is updated daily on week days.
Initial download of the metrics may take a while.