Fig. 9.
Download original image
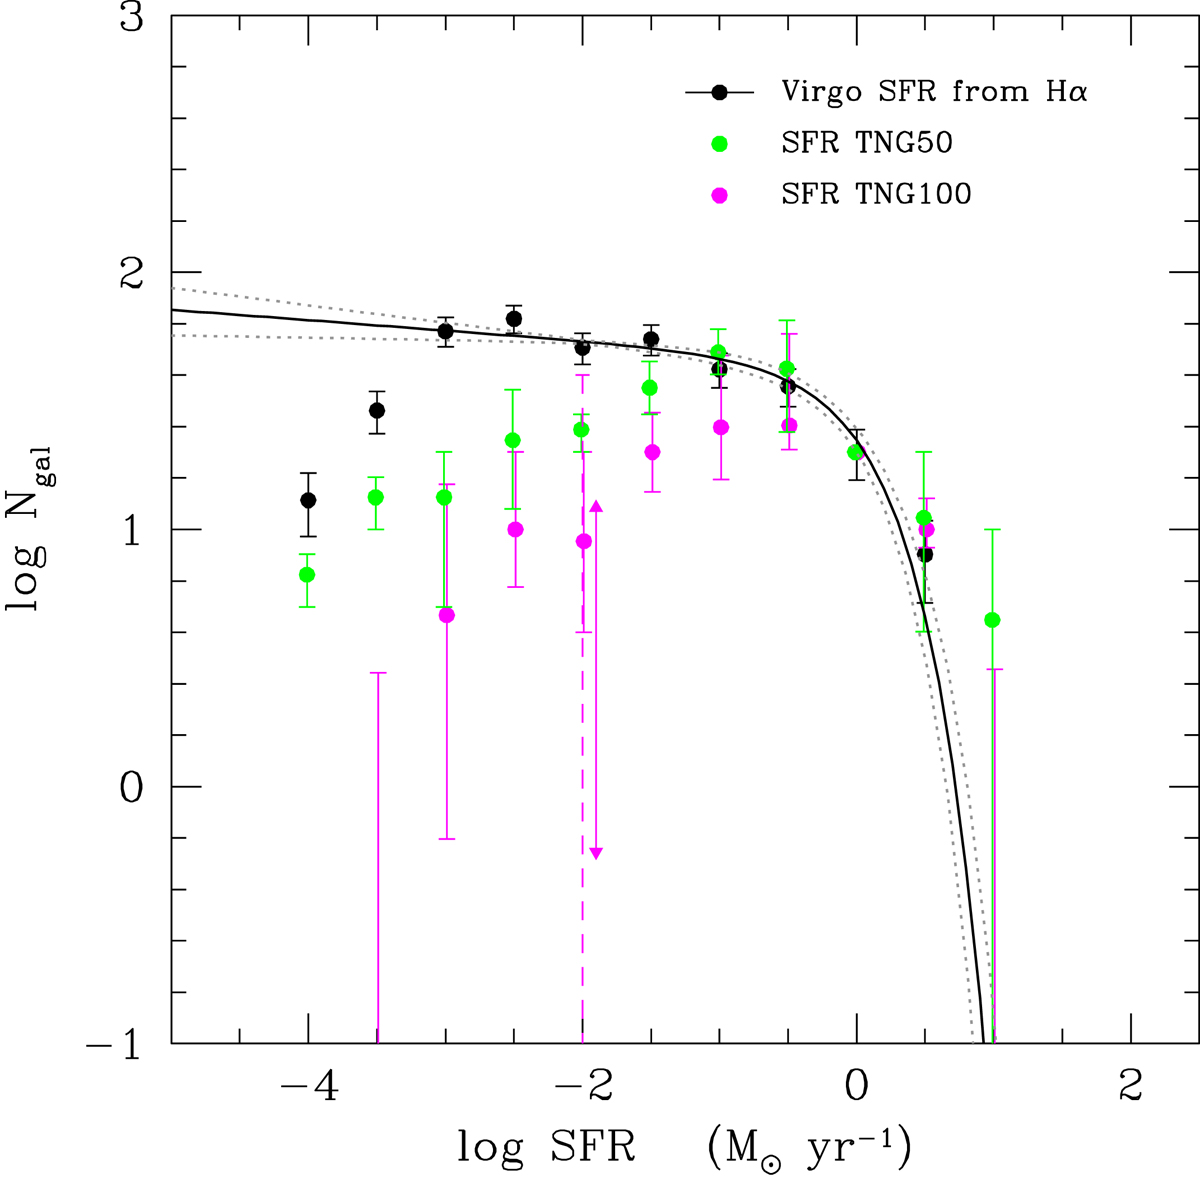
Comparison of the SFR function of the Virgo cluster derived using the VESTIGE Hα imaging data (solid and dotted lines, representing the 1σ confidence interval) and the luminosity functions derived from the TNG50 (green symbols) and TNG100 (magenta symbols) simulated clusters and the galaxies therein. Both TNG luminosity functions are normalised to the number of galaxies within the Virgo cluster sample in the bin centred at SFR = 1 M⊙ yr−1. The error bar in the TNG50 data denotes the dynamic range covered when considering the two simulated massive clusters as separate entities. The error bar in the TNG100 curve shows the 25% and 75% percentiles across the 14 simulated hosts. The vertical dashed magenta line at SFR = 10−2 M⊙ yr−1 gives the dynamic range covered by the 14 simulated clusters, and the vertical double arrow denotes the systematic uncertainties in the way the SFR can be estimated from the simulated cluster members.
Current usage metrics show cumulative count of Article Views (full-text article views including HTML views, PDF and ePub downloads, according to the available data) and Abstracts Views on Vision4Press platform.
Data correspond to usage on the plateform after 2015. The current usage metrics is available 48-96 hours after online publication and is updated daily on week days.
Initial download of the metrics may take a while.