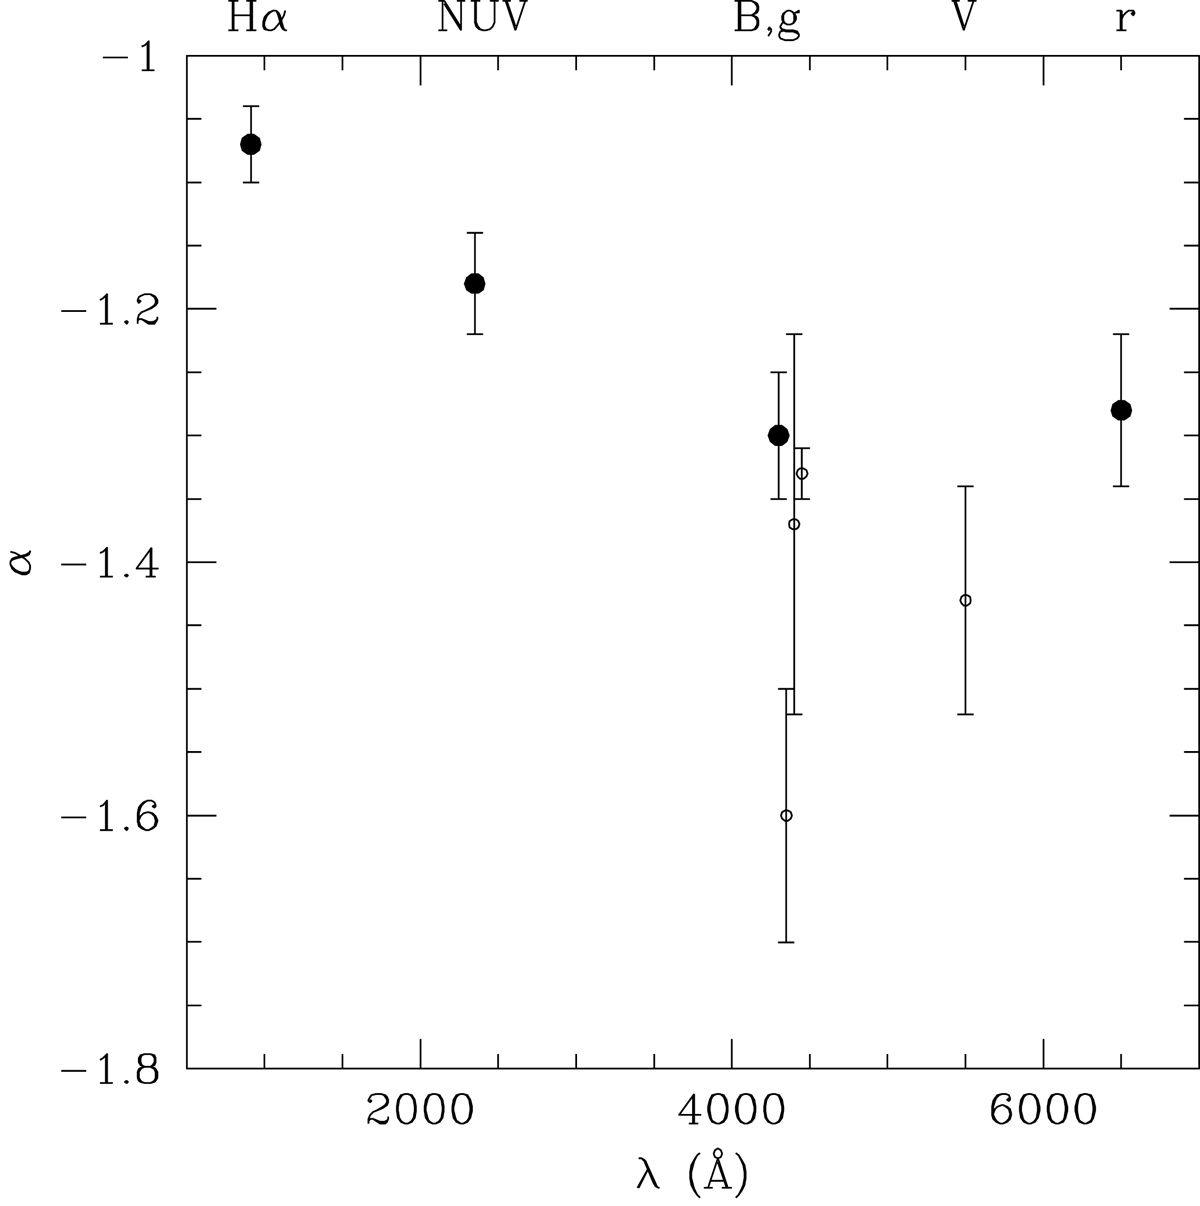
Fig. 7.
Download original image
Relation of the slope of the faint end α of the luminosity function and the wavelength at which the luminosity function has bean measured. The large filled dots show values derived within a footprint comparable to the one used in the VESTIGE survey, and small open squares show values measured within a much more limited region of the cluster. The slope of the luminosity function in the different photometric bands was taken from Boselli et al. (2016c) in the UV, Sandage et al. (1985), Trentham & Hodgkin (2002), and Sabatini et al. (2003) in the B, Ferrarese et al. (2016) in the g, Lieder et al. (2012) in the V, Rines & Geller (2008) in the r. Values in the B and g bands have been slightly shifted in λ to avoid confusion.
Current usage metrics show cumulative count of Article Views (full-text article views including HTML views, PDF and ePub downloads, according to the available data) and Abstracts Views on Vision4Press platform.
Data correspond to usage on the plateform after 2015. The current usage metrics is available 48-96 hours after online publication and is updated daily on week days.
Initial download of the metrics may take a while.