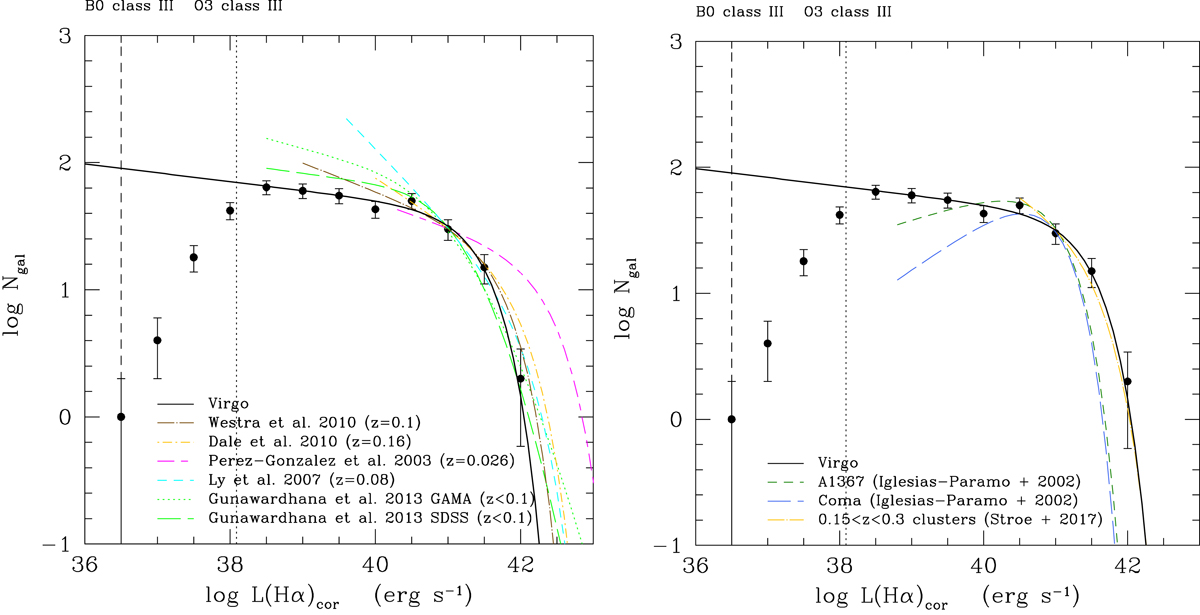
Fig. 6.
Download original image
Hα luminosity function of the Virgo cluster corrected for [NII] contamination and dust attenuation (filled black dots) and its Schechter parametrisation (solid black lines) compared to those derived for field galaxies in the local Universe (z ≲ 0.16, dashed curves; left panel) and star-forming galaxies in nearby clusters (Coma and A1367, from Iglesias-Páramo et al. 2002 and a sample of clusters at 0.15 < z < 0.3 by Stroe et al. 2017; right panel). All luminosity functions are normalised to the number of galaxies within the Virgo cluster sample in the bin centred at L(Hα)cor = 1041 erg s−1. The vertical dotted and dashed black lines indicate the expected Hα luminosity for a single O3 and B0 star, respectively.
Current usage metrics show cumulative count of Article Views (full-text article views including HTML views, PDF and ePub downloads, according to the available data) and Abstracts Views on Vision4Press platform.
Data correspond to usage on the plateform after 2015. The current usage metrics is available 48-96 hours after online publication and is updated daily on week days.
Initial download of the metrics may take a while.