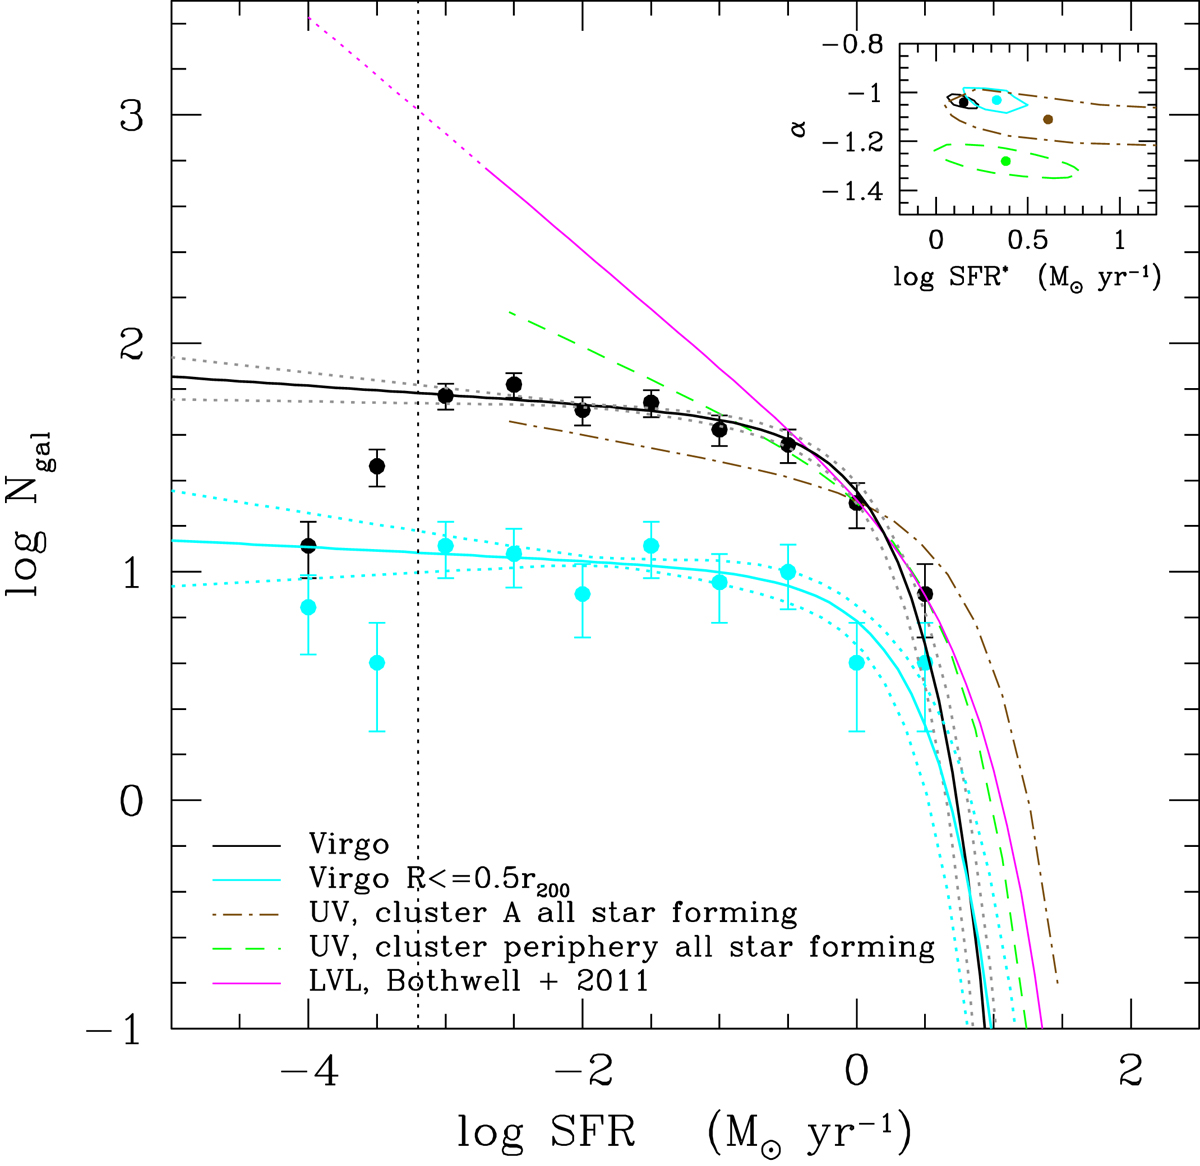
Fig. 4.
Download original image
Comparison of the SFR function of the Virgo cluster derived using the VESTIGE Hα imaging data (filled dots, solid and dotted lines, representing the 1σ confidence interval, in black for the whole cluster, and in cyan for galaxies within the inner R ≤ 0.5 × r200) and using GALEX NUV data extracted from the GUViCS survey (Boselli et al. 2011, 2016c). NUV-derived SFR luminosity functions are for the cluster periphery (galaxies at a distance from M 87 > 1.1 × r200, dashed green line) and for galaxies in the inner cluster A region (< 0.5 r200, dot-dashed brown line). The solid magenta line shows the SFR function derived by Bothwell et al. (2011) for the LVL survey corrected to a Chabrier IMF. This function is accurately estimated down to log SFR ≃ −2.7 M⊙ yr−1, and it is poorly constrained down to log SFR ≃ −4 M⊙ yr−1 (dotted magenta line). These functions are normalised to the number of galaxies within the Virgo cluster sample in the bin centred at SFR = 1 M⊙ yr−1. The vertical dotted black line shows the limit in SFR adopted for the fit.
Current usage metrics show cumulative count of Article Views (full-text article views including HTML views, PDF and ePub downloads, according to the available data) and Abstracts Views on Vision4Press platform.
Data correspond to usage on the plateform after 2015. The current usage metrics is available 48-96 hours after online publication and is updated daily on week days.
Initial download of the metrics may take a while.