Fig. 2.
Download original image
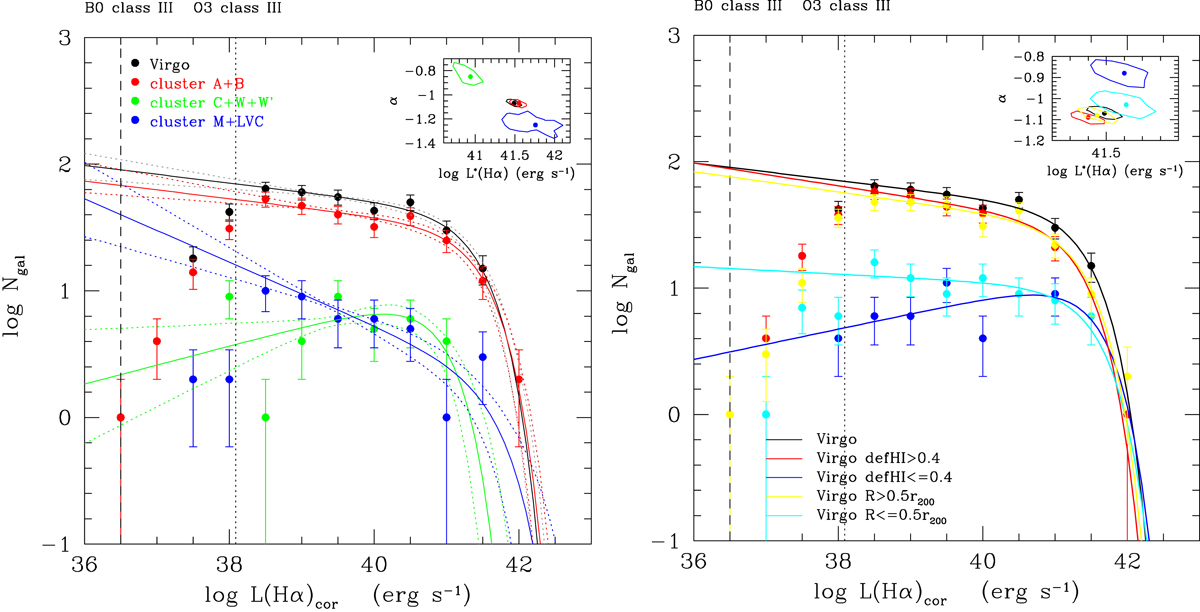
Hα luminosity functions of the Virgo cluster: Left panel: Hα luminosity function corrected for [NII] contamination and dust attenuation and its Schechter parametrisation (solid and dotted lines, representing the 1σ confidence) for the whole member sample (black) compared to that derived for clusters A and B (red), for cluster C, W, and W′ clouds (green), and for the M and LVC clouds (blue). Black and red dots overlap for L(Hα)≤1037 and L(Hα) = 1042 erg s−1. Right panel: same Hα luminosity function for the whole member sample (black) compared to that derived for gas-rich (HI-def ≤ 0.4, blue) and gas-poor (HI-def > 0.4, red) galaxies and for objects located within (cyan) and outside (yellow) R = 0.5 × r200, where R is the distance from M 87, the centre of cluster A. Black, red, and yellow dots overlap at some luminosities. The small panels in the top right corner indicate the 1σ probability distribution of the fitted Schecheter function parameters. The vertical dotted and dashed black lines indicate the expected Hα luminosity for a single O3 and B0 star, respectively.
Current usage metrics show cumulative count of Article Views (full-text article views including HTML views, PDF and ePub downloads, according to the available data) and Abstracts Views on Vision4Press platform.
Data correspond to usage on the plateform after 2015. The current usage metrics is available 48-96 hours after online publication and is updated daily on week days.
Initial download of the metrics may take a while.