Fig. 10.
Download original image
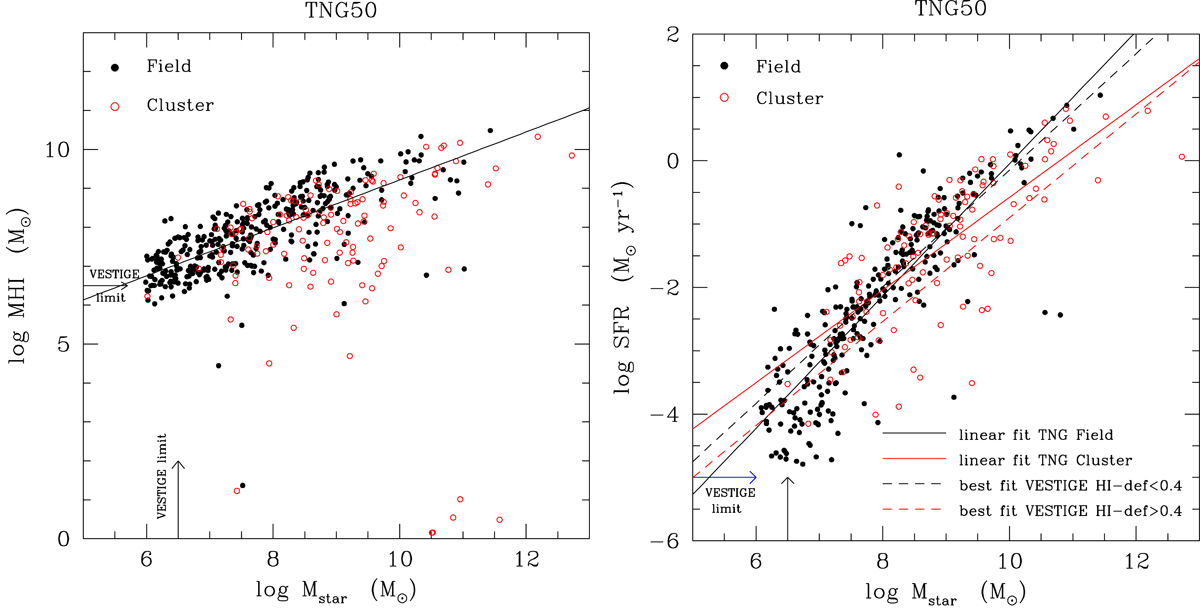
Scaling relation of the atomic gas mass and the stellar mass (left panel) and the SFR and the stellar mass (right panel) for galaxies extracted from the TNG50 simulations. Red empty circles show galaxies within the two massive clusters, and filled black dots show galaxies in the field (R > 2 × r200). The solid lines in the two panels show the linear fit for field (black) and cluster (red) galaxies, and the dashed lines in the right panel show the best fit for gas-rich (black) and gas-poor (red) galaxies in the Virgo cluster derived by Boselli et al. (2023). The black arrows indicate the approximate limit in stellar mass and HI gas mass for the Hα-selected Virgo sample, and the blue arrow shows the limiting sensitivity in SFR for the VESTIGE data.
Current usage metrics show cumulative count of Article Views (full-text article views including HTML views, PDF and ePub downloads, according to the available data) and Abstracts Views on Vision4Press platform.
Data correspond to usage on the plateform after 2015. The current usage metrics is available 48-96 hours after online publication and is updated daily on week days.
Initial download of the metrics may take a while.