Fig. 8
Download original image
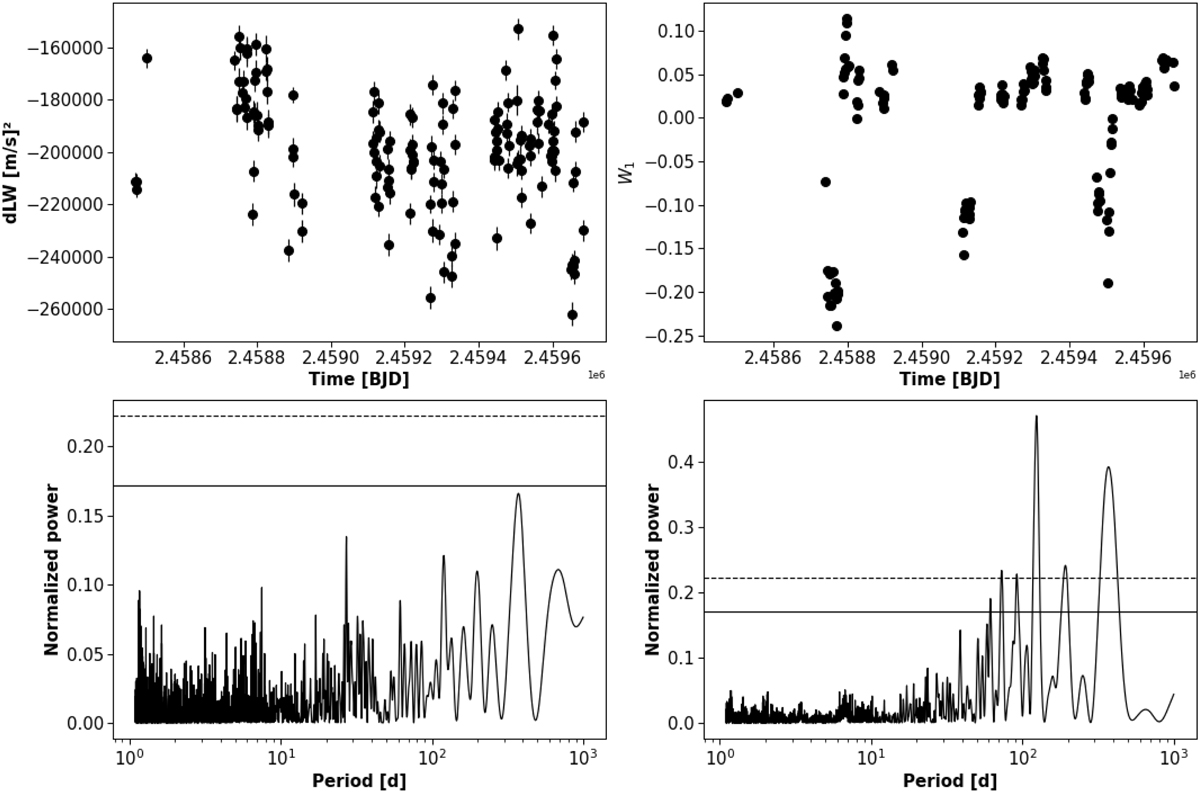
Analysis of dLW and W1 time series. The left panels display, at the top, the dLW time series and its corresponding periodogram at the bottom, which shows no indication of periodicity in the data. On the right, the first principal component of the per-line dLW time series obtained from the wPCA is displayed, which exhibits a pronounced 124-day period peak.
Current usage metrics show cumulative count of Article Views (full-text article views including HTML views, PDF and ePub downloads, according to the available data) and Abstracts Views on Vision4Press platform.
Data correspond to usage on the plateform after 2015. The current usage metrics is available 48-96 hours after online publication and is updated daily on week days.
Initial download of the metrics may take a while.