Fig. 6
Download original image
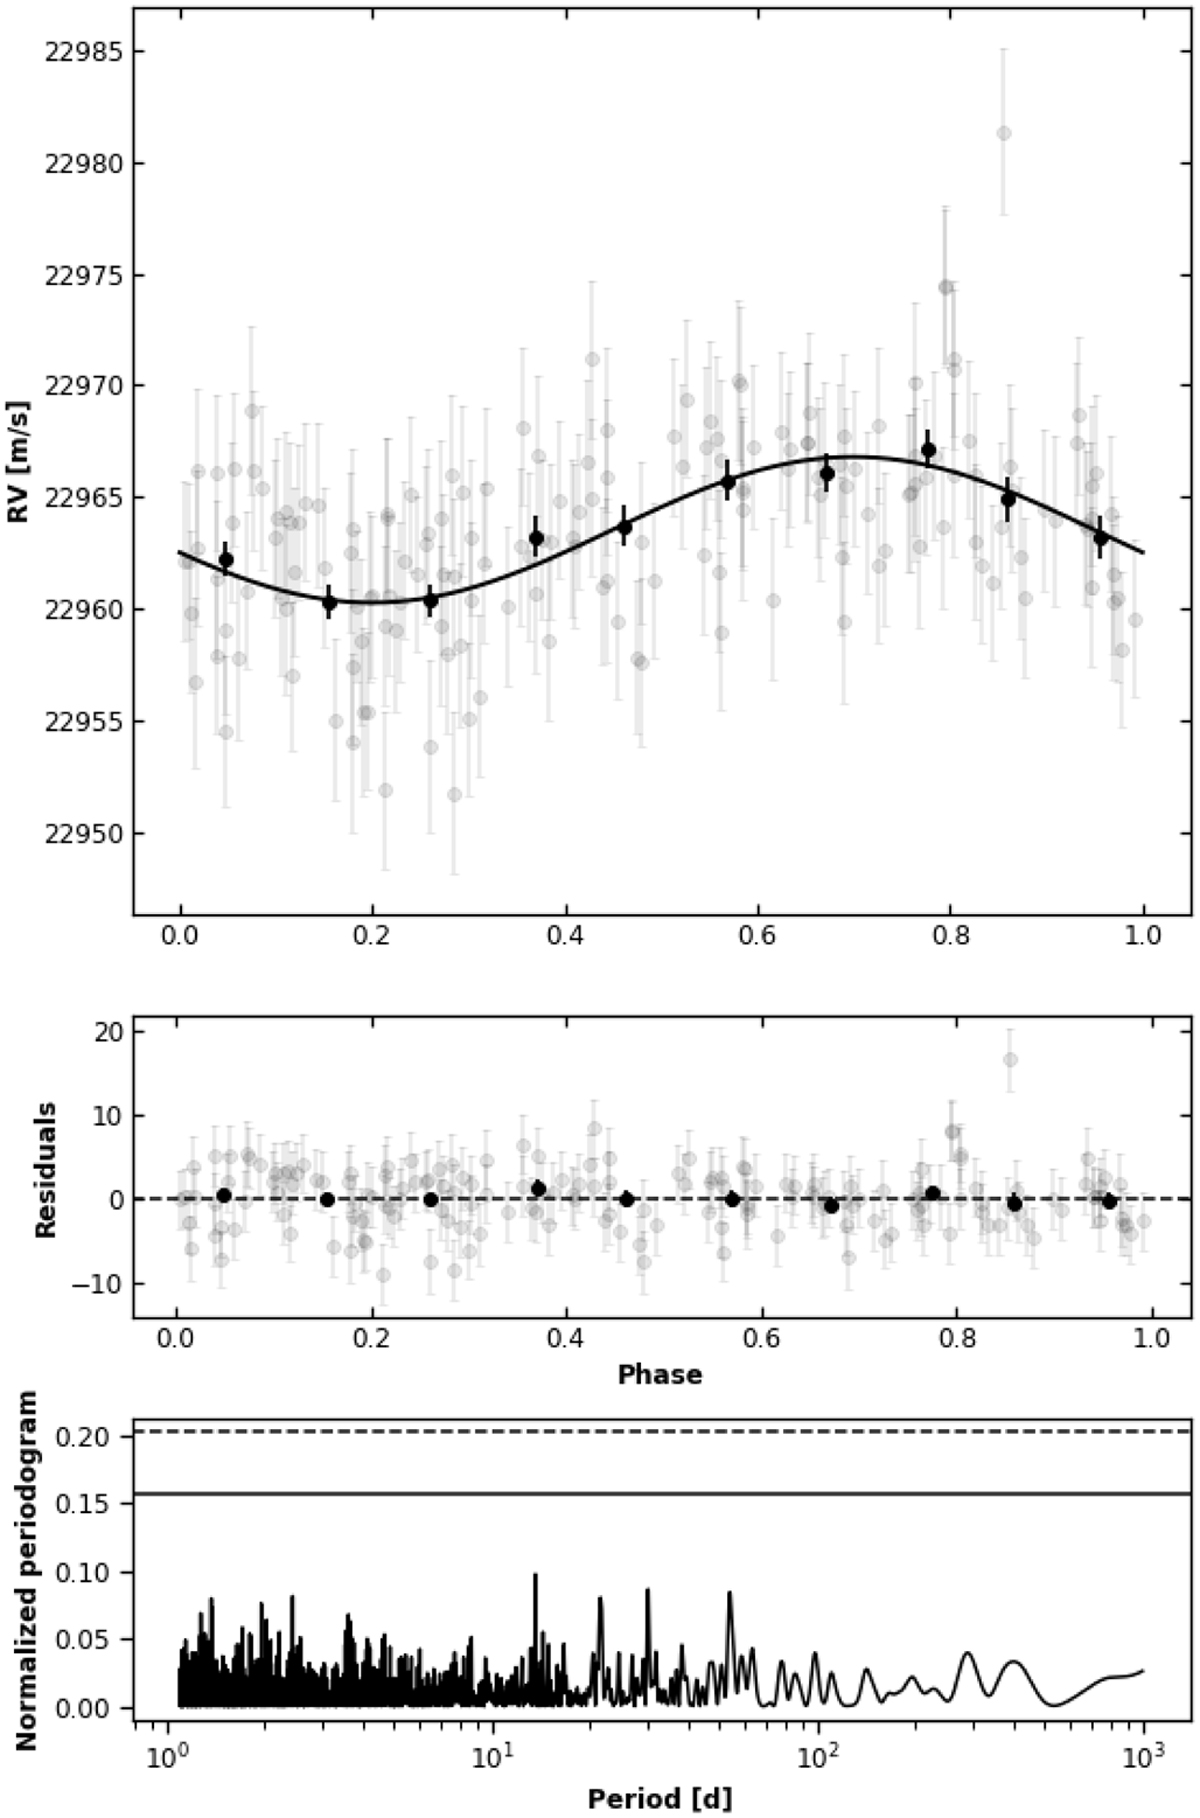
Results of the RV analysis using the Wapiti corrected time series. The top panel illustrates the phase-folding of the planet with the best-fit 14.2-day period, represented by a solid black curve, and the black circles depict the binned RV measurements. The middle panel displays the residuals after the model has been fit, and the bottom panel presents the resulting periodogram, which indicates the absence of any remaining significant signals within the data.
Current usage metrics show cumulative count of Article Views (full-text article views including HTML views, PDF and ePub downloads, according to the available data) and Abstracts Views on Vision4Press platform.
Data correspond to usage on the plateform after 2015. The current usage metrics is available 48-96 hours after online publication and is updated daily on week days.
Initial download of the metrics may take a while.