Fig. B.1
Download original image
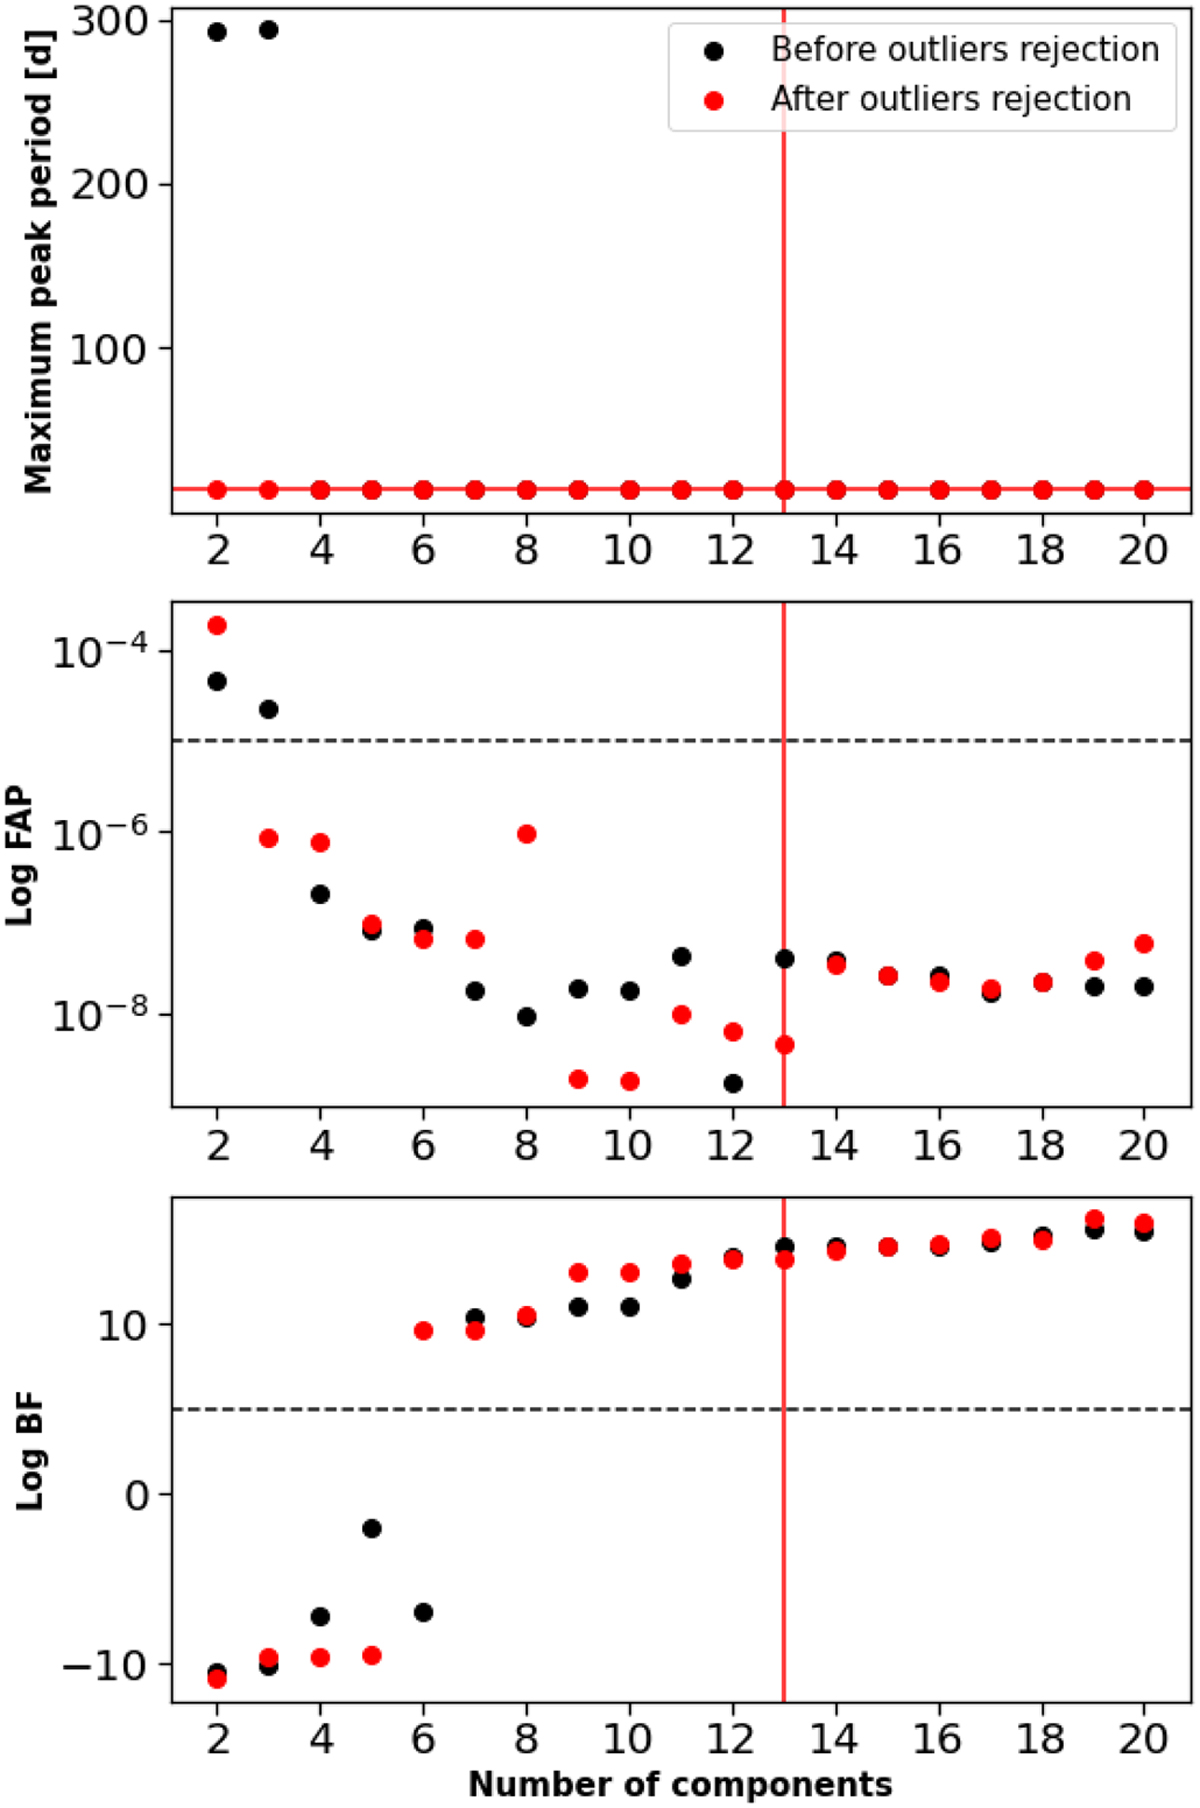
Impact of the choice of number of components on the signal detection. The top panel displays the peak associated with the maximum period in the periodogram when the wPCA reconstruction is eliminated from the data using varying numbers of components. In the middle panel, the logarithm of the FAP linked to this signal is presented, while the bottom panel depicts the log BF evaluating the significance of a 14.2 d Keplerian signal compared to an offset. The black and red data points correspond, respectively, to the outcomes obtained from the pre-and post-outlier rejection RV time series.
Current usage metrics show cumulative count of Article Views (full-text article views including HTML views, PDF and ePub downloads, according to the available data) and Abstracts Views on Vision4Press platform.
Data correspond to usage on the plateform after 2015. The current usage metrics is available 48-96 hours after online publication and is updated daily on week days.
Initial download of the metrics may take a while.