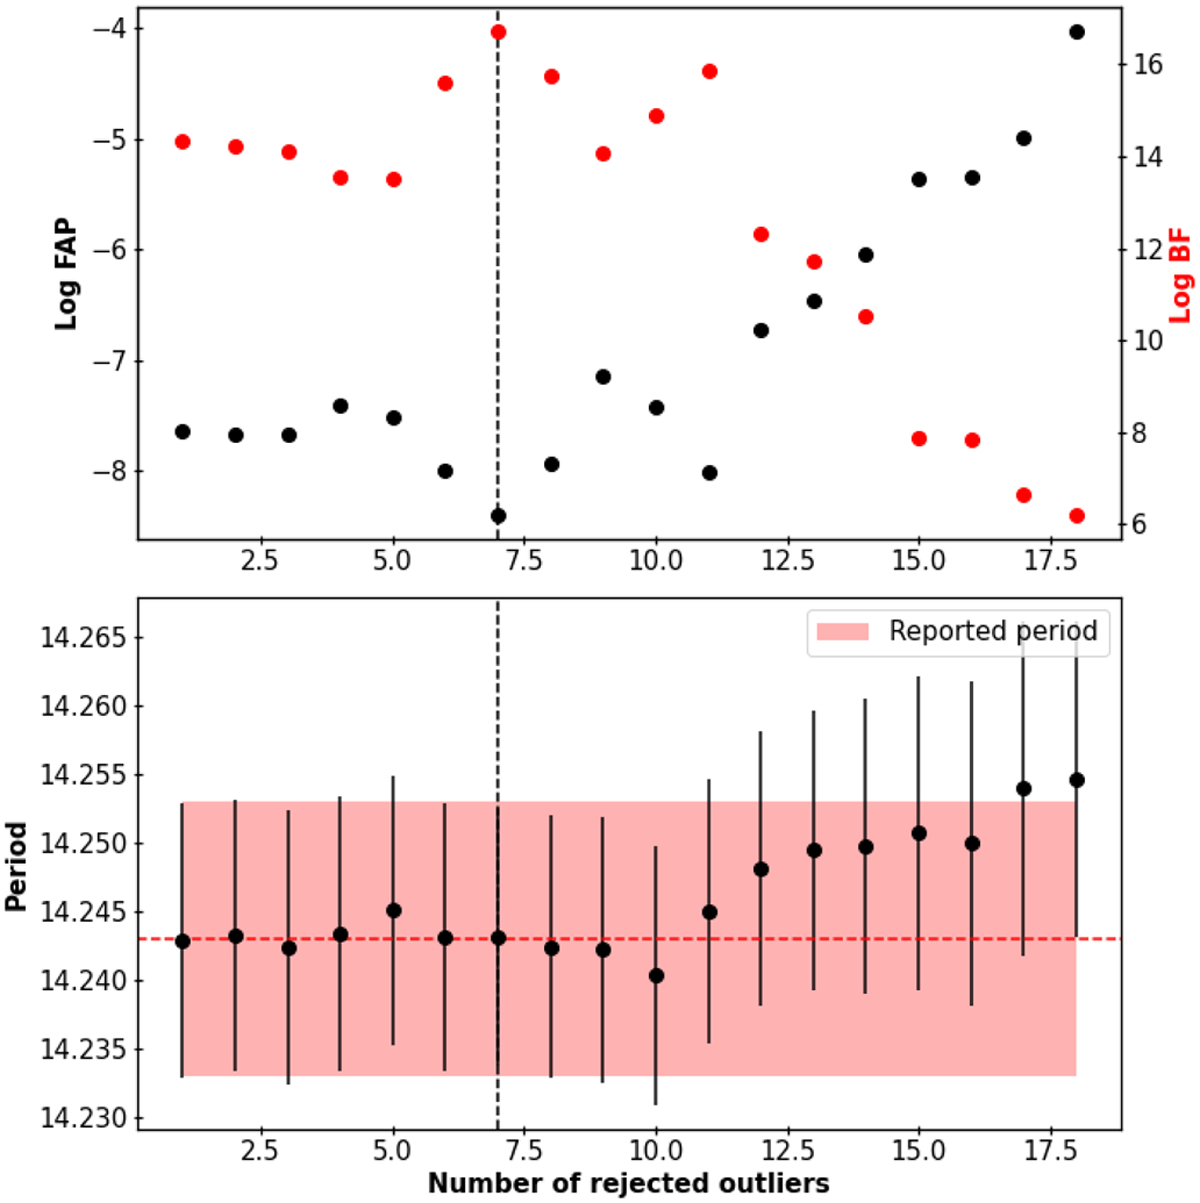
Fig. A.1

Download original image
Effect of removing outliers on the signal detection. The top panel displays the evolution of the log FAP of the signal as the number of outliers removed increases. The red dots overlaid on the plot represent the evolution of the log BF, which follows a similar pattern and reaches its maximum value at the same number of rejected outliers. The bottom panel of the figure shows the detected period in the resulting time series, which remains consistent within error-bars with the reported planetary period.
Current usage metrics show cumulative count of Article Views (full-text article views including HTML views, PDF and ePub downloads, according to the available data) and Abstracts Views on Vision4Press platform.
Data correspond to usage on the plateform after 2015. The current usage metrics is available 48-96 hours after online publication and is updated daily on week days.
Initial download of the metrics may take a while.


