Open Access
Fig. 11
Download original image
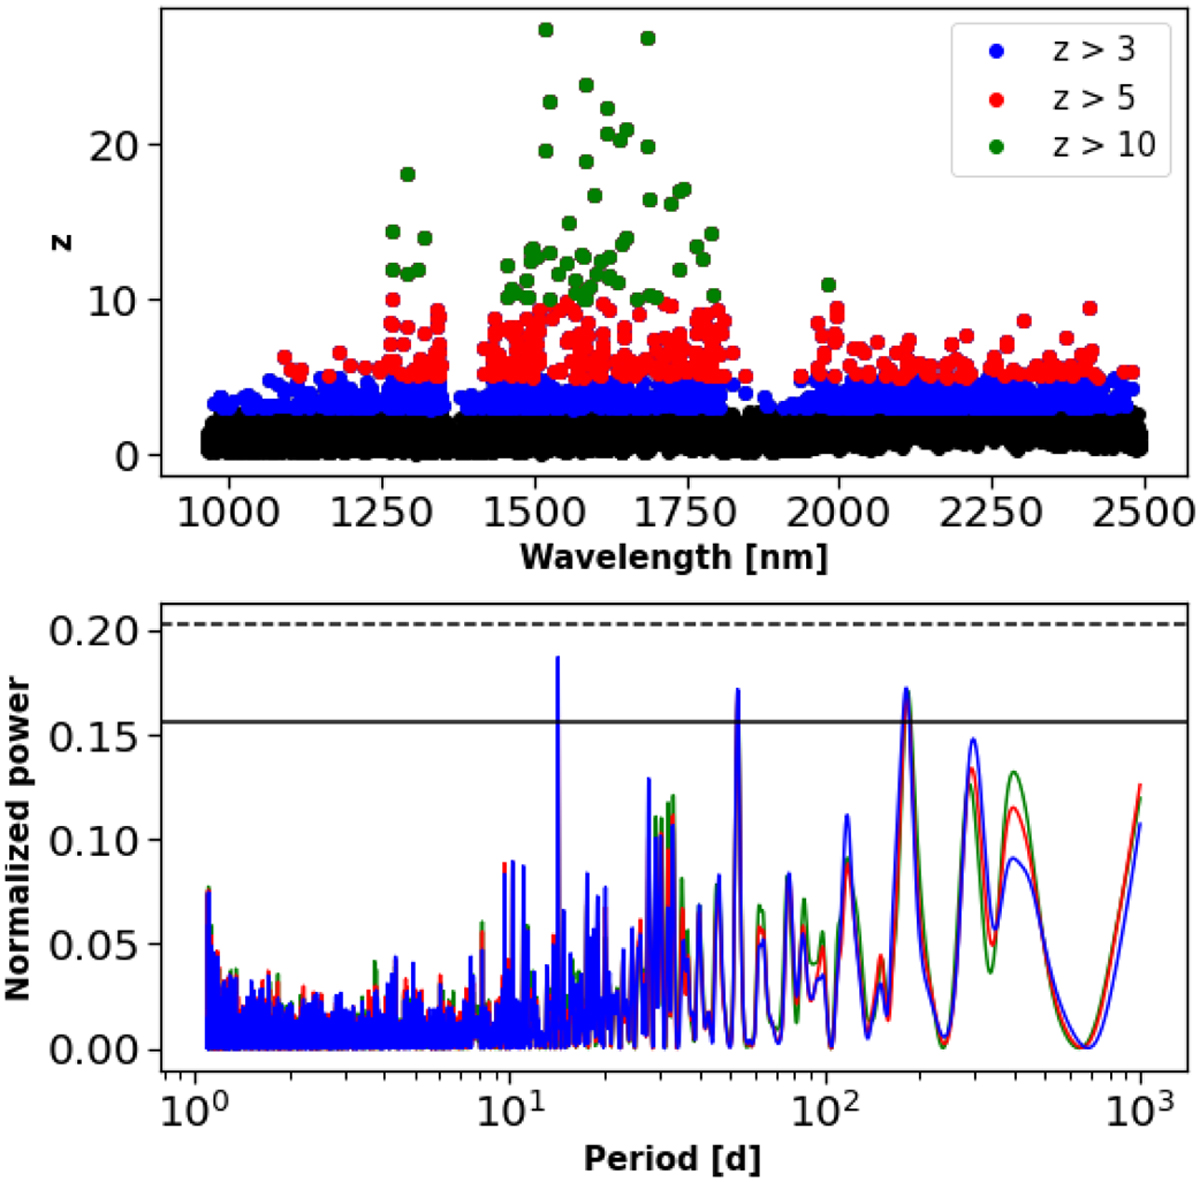
Impact of removing affected lines on the RVs. Top panel shows the z metric of all lines. Bottom panel displays the periodogram of the resulting time series in green, red and blue when respectively rejecting lines with a z value above 10, 5 and 3.
Current usage metrics show cumulative count of Article Views (full-text article views including HTML views, PDF and ePub downloads, according to the available data) and Abstracts Views on Vision4Press platform.
Data correspond to usage on the plateform after 2015. The current usage metrics is available 48-96 hours after online publication and is updated daily on week days.
Initial download of the metrics may take a while.