Fig. 10
Download original image
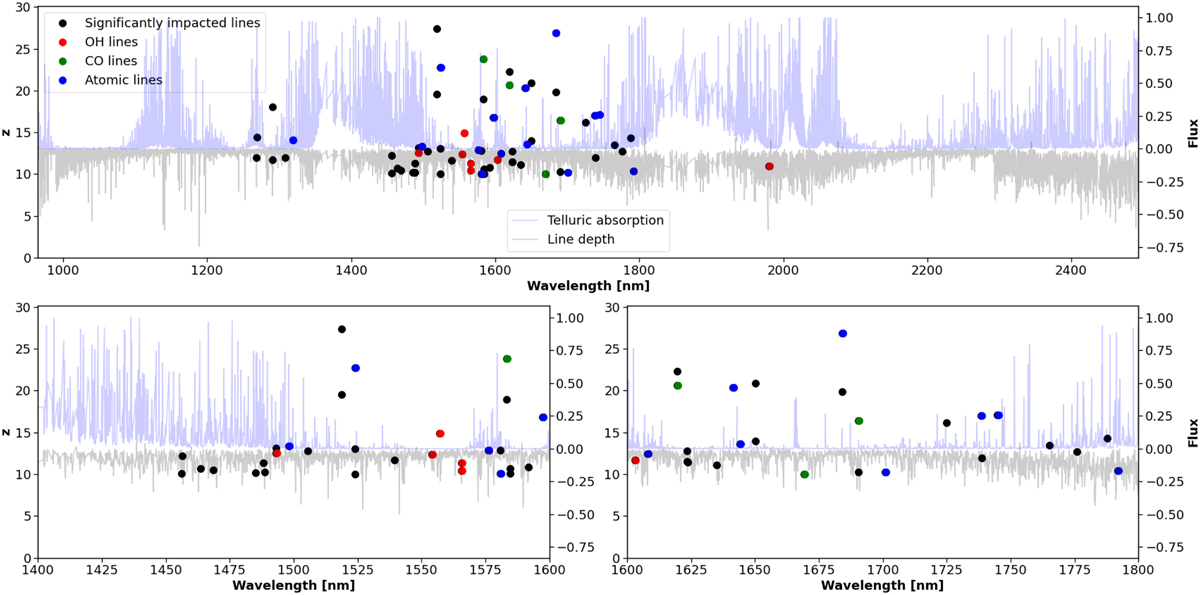
Scores of the most affected lines using all components. In the top panel, the lines that are significantly affected by the component are displayed in black. If these lines could be attributed to a OH line and a CO line, they are color-coded in red and green respectively, while if they correspond to an atomic line, they are colored in blue. The telluric absorption computed with TAPAS is also displayed, as well as the template of GJ 251 used by the LBL algorithm. The two lower panels provide zoomed-in views from 1400 to 1800 nm.
Current usage metrics show cumulative count of Article Views (full-text article views including HTML views, PDF and ePub downloads, according to the available data) and Abstracts Views on Vision4Press platform.
Data correspond to usage on the plateform after 2015. The current usage metrics is available 48-96 hours after online publication and is updated daily on week days.
Initial download of the metrics may take a while.