Fig. 9.
Download original image
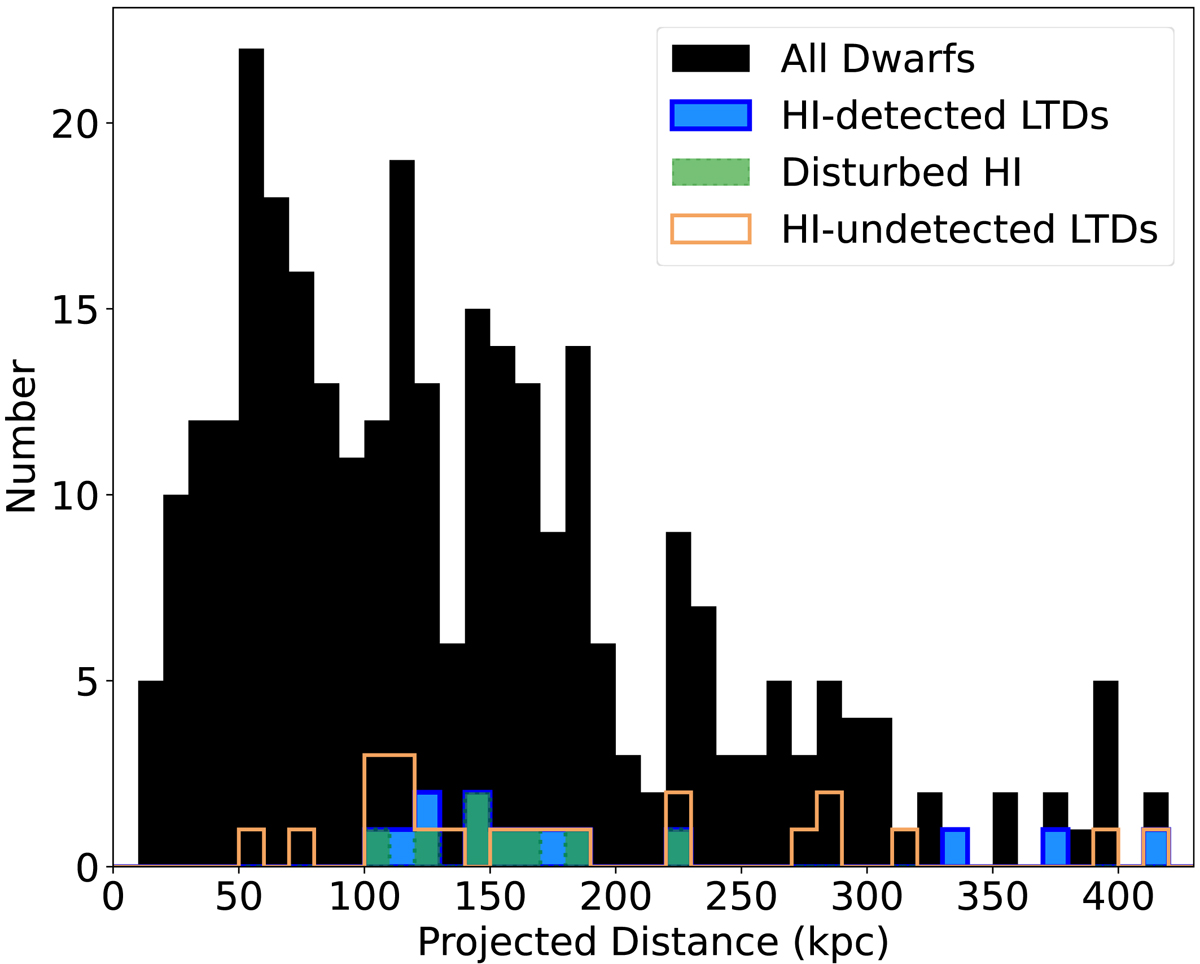
Projected distance to nearest massive galaxy. All dwarfs in our observed area are shown as the filled-black histogram. H I-detected LTDs are shown in the blue-filled histogram, LTDs with disturbed H I are shown by the dashed green-filled histogram and H I-undetected LTDs are the open orange histogram. There are no H I-detected LTDs within a projected distance of 100 kpc to their nearest massive galaxy, implying that massive galaxies play an active role in the removal of H I from LTDs.
Current usage metrics show cumulative count of Article Views (full-text article views including HTML views, PDF and ePub downloads, according to the available data) and Abstracts Views on Vision4Press platform.
Data correspond to usage on the plateform after 2015. The current usage metrics is available 48-96 hours after online publication and is updated daily on week days.
Initial download of the metrics may take a while.