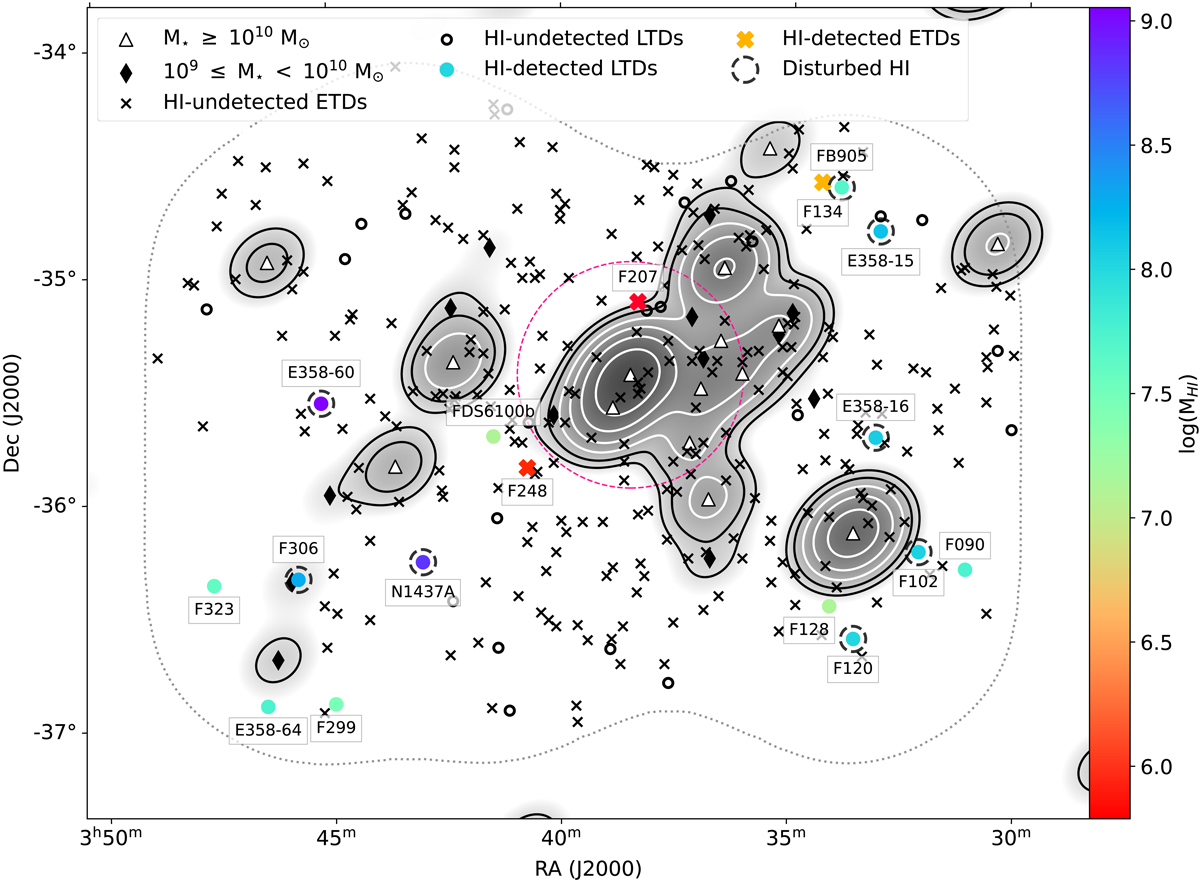
Fig. 8.
Download original image
Fornax cluster projected density field. The background image shows the projected density field on a log scale, produced by Gaussian smoothing the luminosity ratio relative to the BCG (NGC 1399), at the position of each galaxy. The (black and white) contours emphasise the density field, where the lowest shows the influence of M⋆ ≃ 5 × 10⁹ M⊙ and increases by 2n. The grey dotted line shows the border of our observed area (same as Fig. 2), and the pink dashed circle is 0.25 Rvir. Black crosses and open black circles are the H I-undetected ETDs and LTDs. The filled circles and thick crosses are the H I-detected ETDs and LTDs, which have been labelled and coloured by their MHI. LTDs with disturbed H I morphologies are enclosed with dashed black circles. Black diamonds show the intermediate galaxies and the white triangles are the massive galaxies. The projected substructure is dominated by the brightest (hence most massive) galaxies, and the H I-detected dwarfs avoid the most massive potentials (i.e. cluster centre and massive galaxies) in the cluster.
Current usage metrics show cumulative count of Article Views (full-text article views including HTML views, PDF and ePub downloads, according to the available data) and Abstracts Views on Vision4Press platform.
Data correspond to usage on the plateform after 2015. The current usage metrics is available 48-96 hours after online publication and is updated daily on week days.
Initial download of the metrics may take a while.