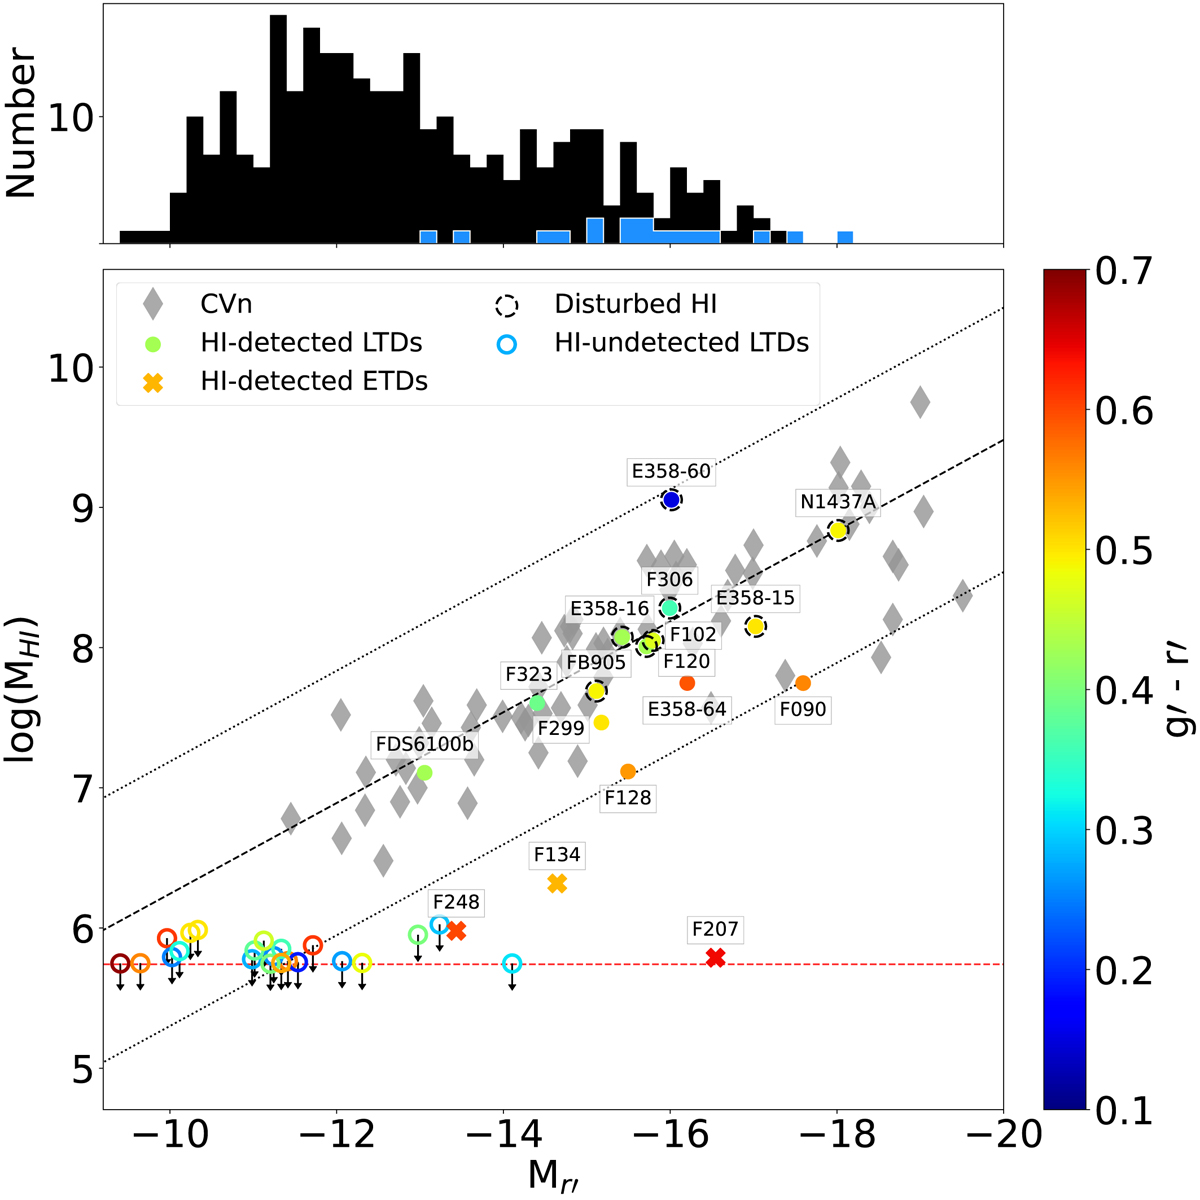
Fig. 5.
Download original image
Luminosity-H I relation. The main panel shows Mr′ as a function of MHI. A control sample of CVn dwarfs is shown in grey diamonds and the linear fit with 3σ scatter in the range of −18 < Mr′ ≤ −12 are shown as the black dashed and dotted lines, respectively. Fornax LTDs are shown as circles, where the filled circles have been detected in H I and the open circles have not. Upper limits of the H I-undetected LTDs are shown as downward arrows. Dashed circles enclose the LTDs with H I-disturbed morphologies and thick crosses show the H I-detected Fornax ETDs. All H I-detected dwarfs are labelled and coloured by their g′−r′ colour. The dashed red line shows our H I detection limit of MHI = 5 × 10⁵ M⊙. In the upper panel, the black histogram shows all dwarfs in our field, with H I-detected dwarfs shown in blue. All of the H I-detected LTDs lie within the 3σ scatter of the CVn fit, implying that a significant amount of H I has not been lost yet even those with disturbed H I morphologies.
Current usage metrics show cumulative count of Article Views (full-text article views including HTML views, PDF and ePub downloads, according to the available data) and Abstracts Views on Vision4Press platform.
Data correspond to usage on the plateform after 2015. The current usage metrics is available 48-96 hours after online publication and is updated daily on week days.
Initial download of the metrics may take a while.