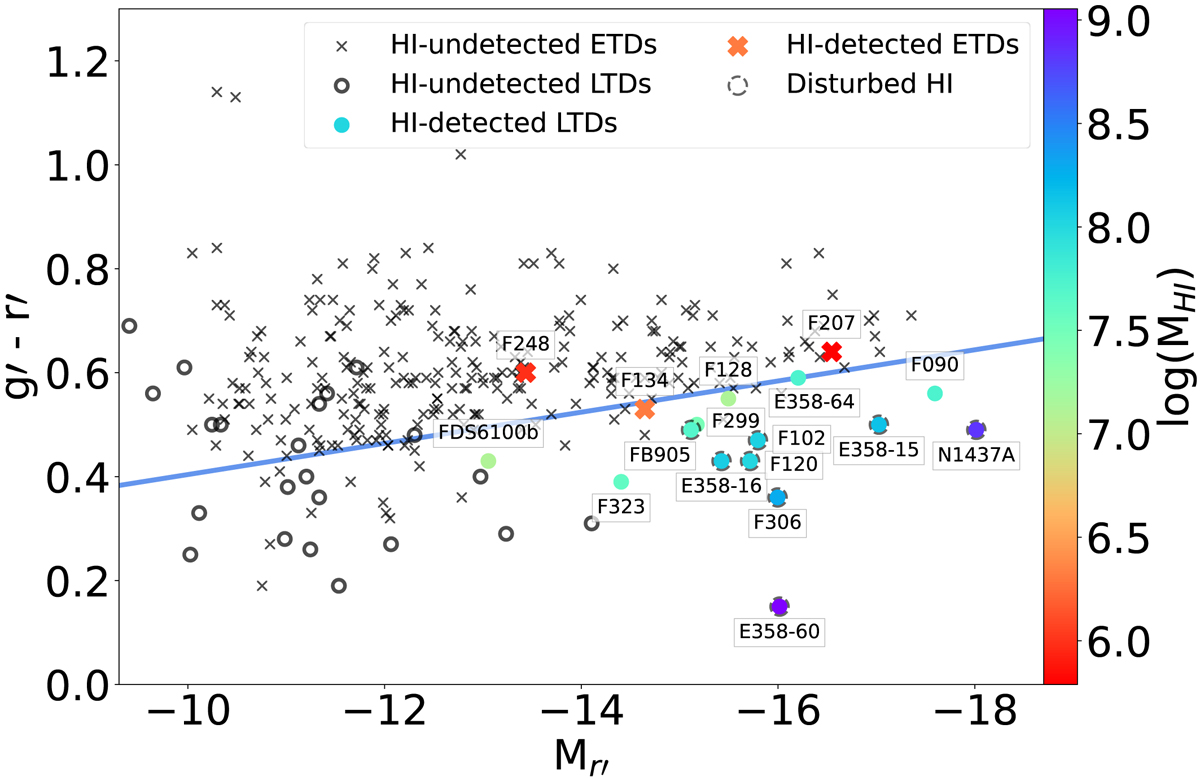
Fig. 4.
Download original image
Colour-magnitude diagram of dwarf galaxies within the ∼2.5 × 4 deg2 area shown in Fig. 2. Circles show the LTDs and crosses are the ETDs. The dwarfs detected in H I have been labelled and coloured by their MHI. The LTDs with H I are shown as filled circles and the ETDs with H I are the thick crosses. The LTDs with disturbed H I morphologies are enclosed by dashed circles. The solid blue line separates the blue cloud from the red sequence. As expected, the bluer, brighter LTDs have a higher MHI.
Current usage metrics show cumulative count of Article Views (full-text article views including HTML views, PDF and ePub downloads, according to the available data) and Abstracts Views on Vision4Press platform.
Data correspond to usage on the plateform after 2015. The current usage metrics is available 48-96 hours after online publication and is updated daily on week days.
Initial download of the metrics may take a while.