Fig. 3.
Download original image
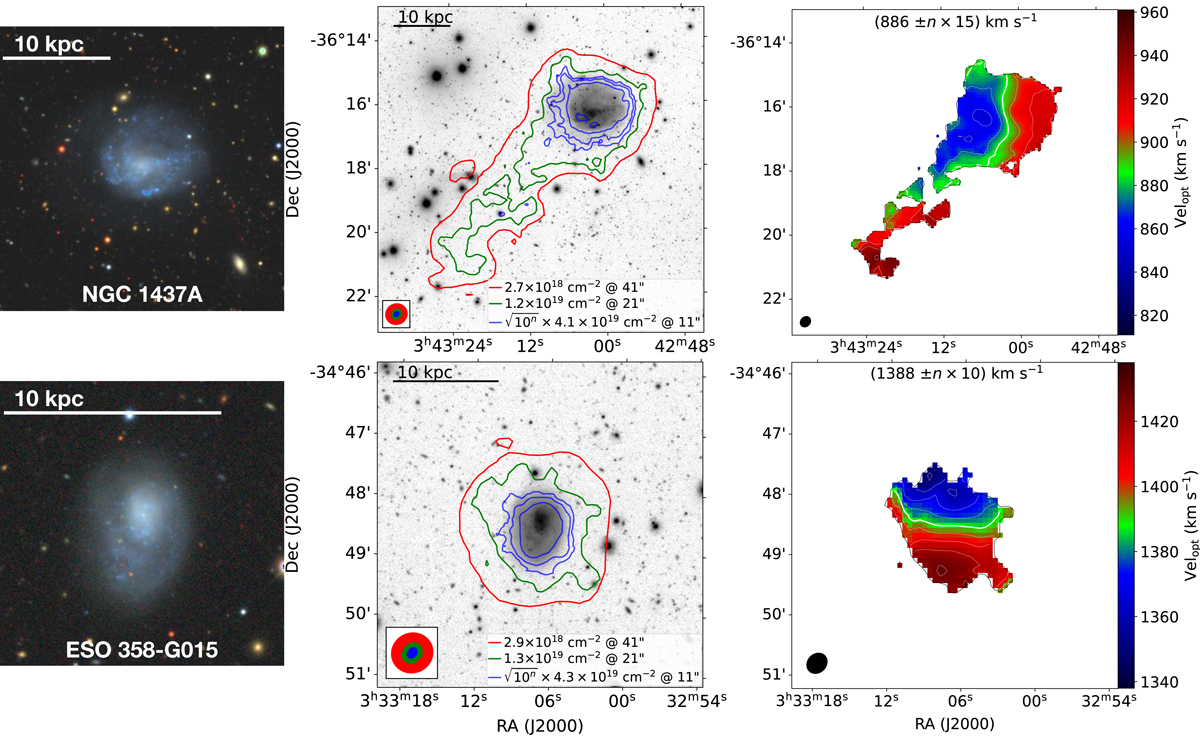
Preview of the dwarf optical cutouts, multi-resolution MFS H I overlays and velocity fields. The full figure with all the H I detections are shown in Fig. A.1. The left panel shows the optical three-colour postage stamp of each dwarf, the middle panel shows the H I contours overlaid on the FDS (DECaLS for FCC 323) optical image where the blue contours show the 11″ H I emission above 3σ in steps of ![]() and the green and red contours show the 3σ H I emission from the 21″ and 41″ images. The lowest column density sensitivities are labelled in accordance with the local rms over a 25 km s−1 line-width and the synthesised beam for each resolution are shown in the bottom left inset with their respective colours. The right panel shows the 21″ H I velocity field. The systemic velocity is the thick white contour with the value shown up the top and the synthesised beam is shown in black on the bottom left.
and the green and red contours show the 3σ H I emission from the 21″ and 41″ images. The lowest column density sensitivities are labelled in accordance with the local rms over a 25 km s−1 line-width and the synthesised beam for each resolution are shown in the bottom left inset with their respective colours. The right panel shows the 21″ H I velocity field. The systemic velocity is the thick white contour with the value shown up the top and the synthesised beam is shown in black on the bottom left.
Current usage metrics show cumulative count of Article Views (full-text article views including HTML views, PDF and ePub downloads, according to the available data) and Abstracts Views on Vision4Press platform.
Data correspond to usage on the plateform after 2015. The current usage metrics is available 48-96 hours after online publication and is updated daily on week days.
Initial download of the metrics may take a while.