Fig. 2.
Download original image
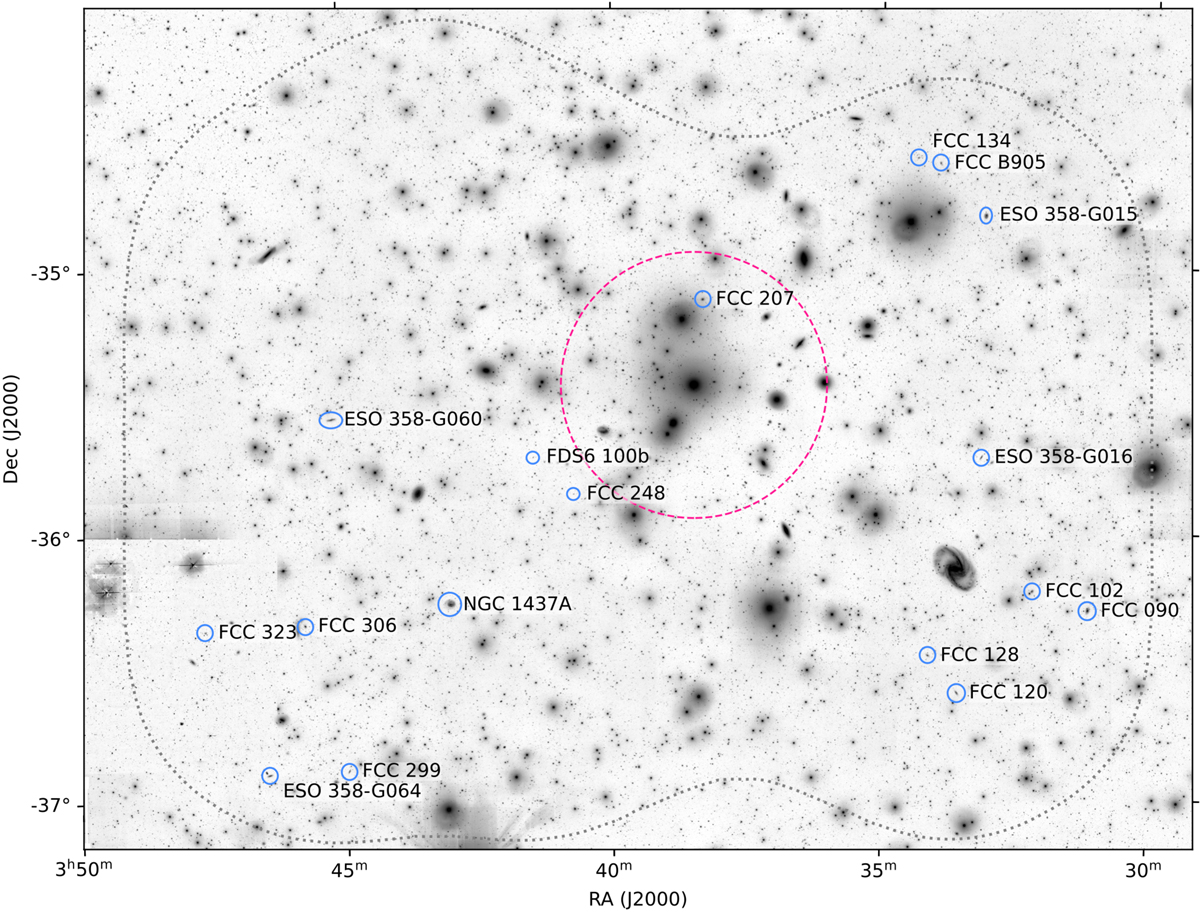
H I-detected dwarfs in the Fornax cluster. The background is the FDS g′-band optical image, except in the region of FCC 323 that has been filled in with DECaLS images. The dwarfs detected in H I are shown in the blue ellipses with their respective labels. The dotted grey border denotes the ∼2.5 × 4 deg2 area analysed in this work. The pink dashed circle shows 0.25 Rvir.
Current usage metrics show cumulative count of Article Views (full-text article views including HTML views, PDF and ePub downloads, according to the available data) and Abstracts Views on Vision4Press platform.
Data correspond to usage on the plateform after 2015. The current usage metrics is available 48-96 hours after online publication and is updated daily on week days.
Initial download of the metrics may take a while.