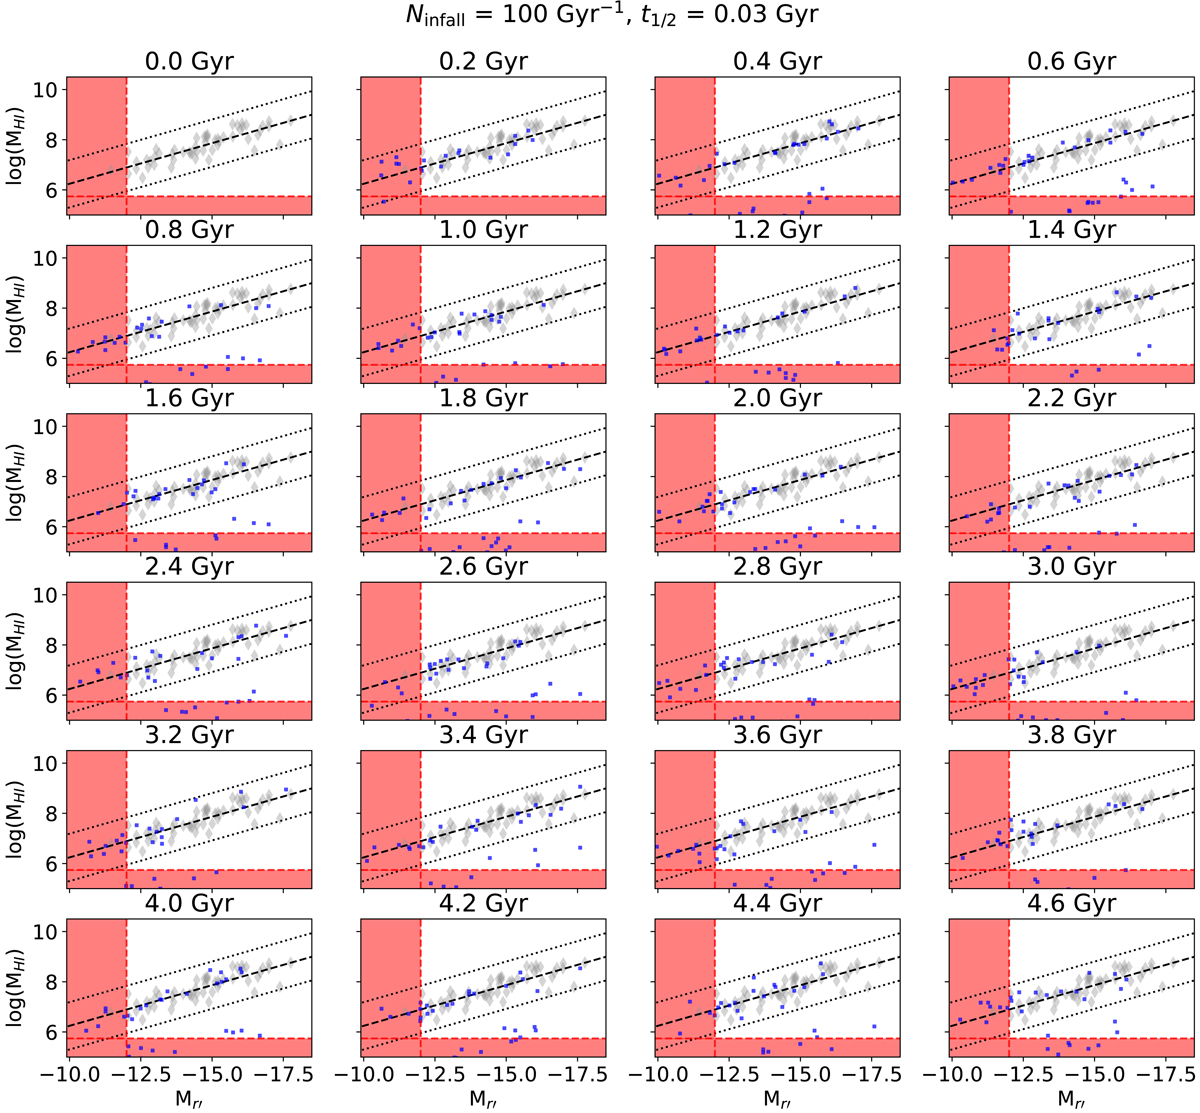
Fig. 10.
Download original image
Toy model of H I removal in the cluster. The best results to reproduce Fig. 5, showing what we would observe every 0.2 Gyr. The grey diamonds are the CVn galaxies, the dashed black line shows the linear fit used to populate infalling galaxies to the CVn galaxies and the dotted lines show the 3σ scatter. The blue filled circles are galaxies in the cluster and the red dashed lines are the observational constraints both in Mr′ and MHI, such that we would not detect a galaxy in H I in the red shaded regions. With Ninfall = 100 Gyr−1 and t1/2 = 0.03 Gyr we are able to qualitatively reproduce what we observe in Fig. 5.
Current usage metrics show cumulative count of Article Views (full-text article views including HTML views, PDF and ePub downloads, according to the available data) and Abstracts Views on Vision4Press platform.
Data correspond to usage on the plateform after 2015. The current usage metrics is available 48-96 hours after online publication and is updated daily on week days.
Initial download of the metrics may take a while.