Fig. 8.
Download original image
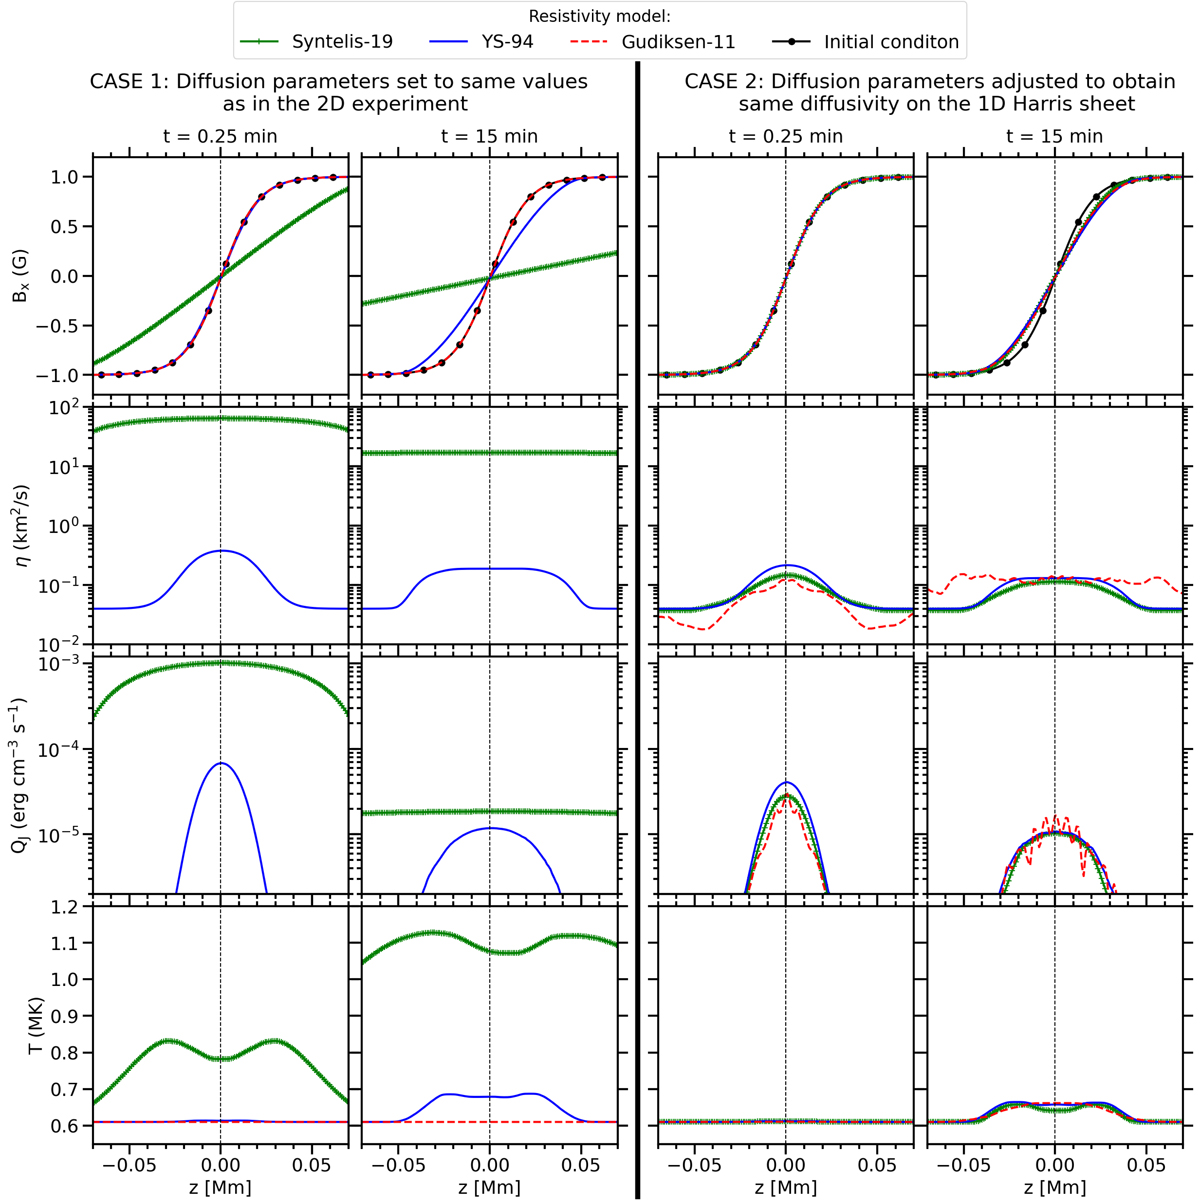
Evolution of the 1D Harris current sheet. From top to bottom: the magnetic field Bx, the resistivity η, the Joule heating QJ, and the temperature T are plotted as obtained by using the Syntelis-19 (green), YS-94 (blue), and Gudiksen-11 (red) resistivity models. The first and second columns show the results, measured at different times, setting the diffusion parameters to the same values as used in the 2D experiment. The third and fourth columns show the results obtained after adjusting these diffusion parameters to obtain the same behaviour on this 1D Harris sheet for the three resistivity models.
Current usage metrics show cumulative count of Article Views (full-text article views including HTML views, PDF and ePub downloads, according to the available data) and Abstracts Views on Vision4Press platform.
Data correspond to usage on the plateform after 2015. The current usage metrics is available 48-96 hours after online publication and is updated daily on week days.
Initial download of the metrics may take a while.