Fig. 5.
Download original image
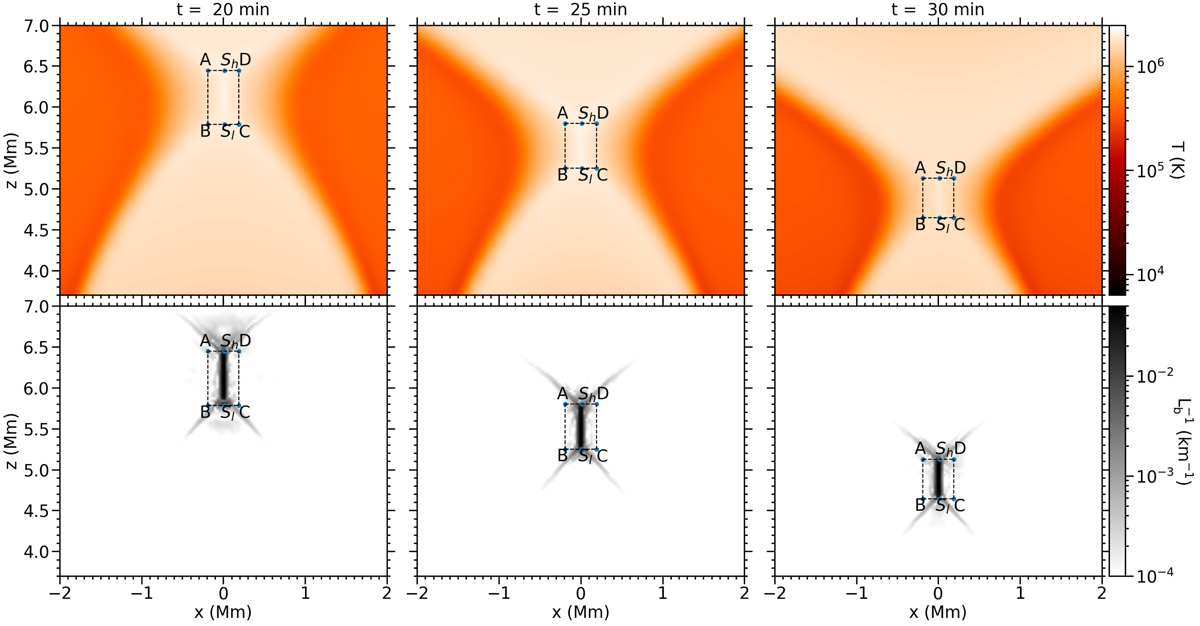
Evolution of the current sheet in the 2D flux cancellation experiment for the Gudiksen-11 resistivity model at different times (columns). Top: temperature maps zoomed in on the region around the elongated current sheet. Bottom: corresponding maps of the inverse characteristic length ![]() . The rectangle marks the region around the current sheet, and the inflow parameters are measured at the line segments AB and CD. Sh and Sl are the top and bottom of the current sheet, respectively.
. The rectangle marks the region around the current sheet, and the inflow parameters are measured at the line segments AB and CD. Sh and Sl are the top and bottom of the current sheet, respectively.
Current usage metrics show cumulative count of Article Views (full-text article views including HTML views, PDF and ePub downloads, according to the available data) and Abstracts Views on Vision4Press platform.
Data correspond to usage on the plateform after 2015. The current usage metrics is available 48-96 hours after online publication and is updated daily on week days.
Initial download of the metrics may take a while.