Open Access
Fig. 4.
Download original image
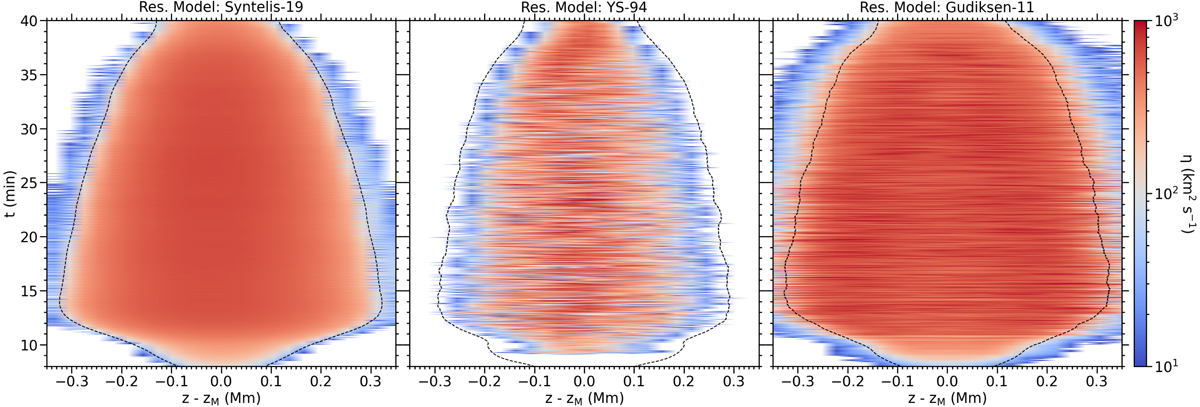
Evolution of the resistivity η along the current sheet for each resistivity model. The resistivity is measured at x = 0 and is shown as function of the height relative to the current sheet midpoint, zM. The dashed lines mark the top and bottom of the current sheet, which are annotated as Sh and Sl, respectively, in Fig. 5.
Current usage metrics show cumulative count of Article Views (full-text article views including HTML views, PDF and ePub downloads, according to the available data) and Abstracts Views on Vision4Press platform.
Data correspond to usage on the plateform after 2015. The current usage metrics is available 48-96 hours after online publication and is updated daily on week days.
Initial download of the metrics may take a while.