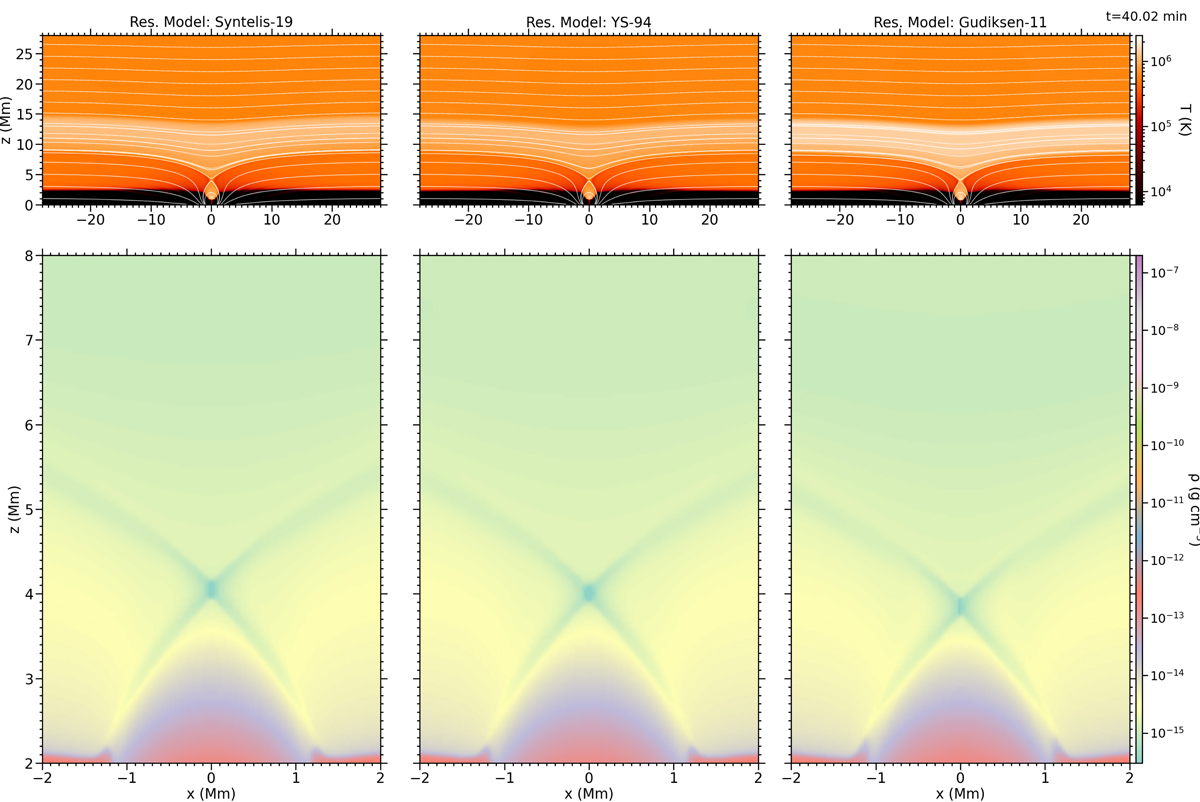
Fig. 3.
Download original image
Atmospheric response in the 2D flux cancellation experiment for the three resistivity models (columns) at t = 40 min. Top: maps of the temperature with the magnetic field topology superimposed. Bottom: maps of the mass density around the reconnection site. A movie of the full evolution from t = 0 to t = 40 min of these maps is available online.
Current usage metrics show cumulative count of Article Views (full-text article views including HTML views, PDF and ePub downloads, according to the available data) and Abstracts Views on Vision4Press platform.
Data correspond to usage on the plateform after 2015. The current usage metrics is available 48-96 hours after online publication and is updated daily on week days.
Initial download of the metrics may take a while.