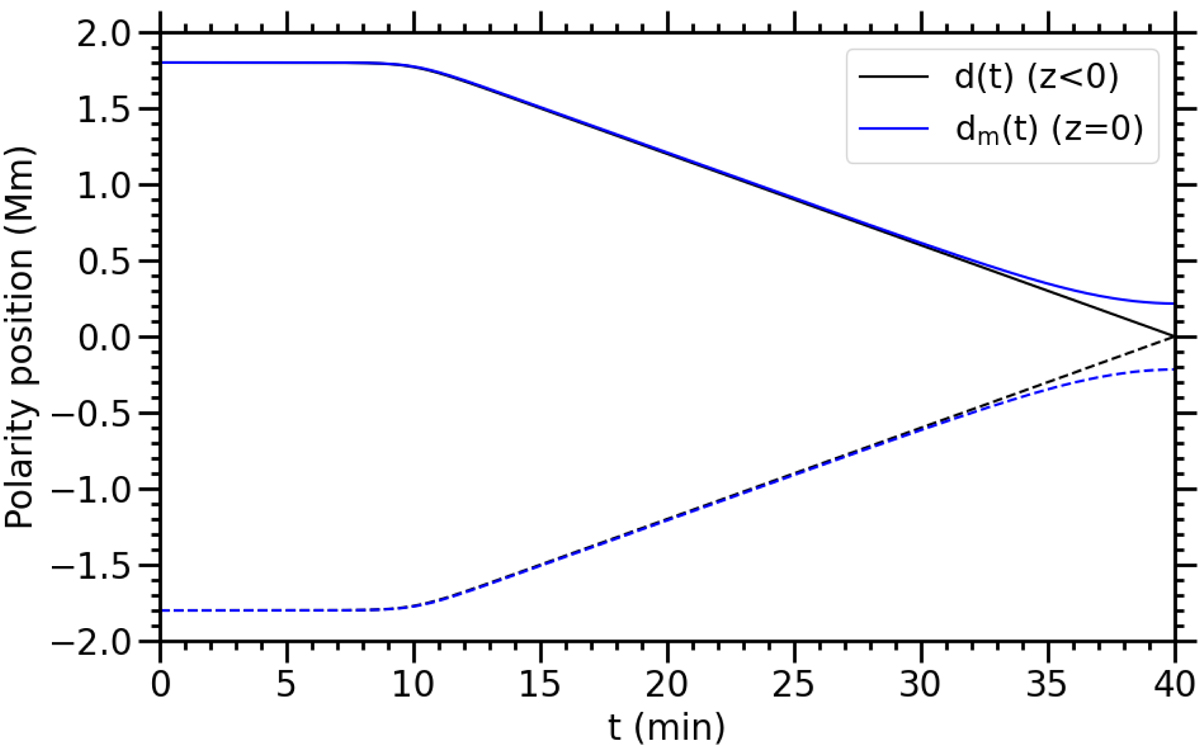
Fig. 2.
Download original image
Evolution of the magnetic polarities in the 2D flux cancellation experiment. The black lines show the horizontal position of each source, given by Eq. (25). The blue lines show the horizontal position of the photospheric polarities, that is, the location along z = 0 where Bz reaches its maximum value. The results here are from the simulation with the Gudiksen-11 resistivity model, but nearly identical results are obtained with the other two resistivity models.
Current usage metrics show cumulative count of Article Views (full-text article views including HTML views, PDF and ePub downloads, according to the available data) and Abstracts Views on Vision4Press platform.
Data correspond to usage on the plateform after 2015. The current usage metrics is available 48-96 hours after online publication and is updated daily on week days.
Initial download of the metrics may take a while.