Fig. 2.
Download original image
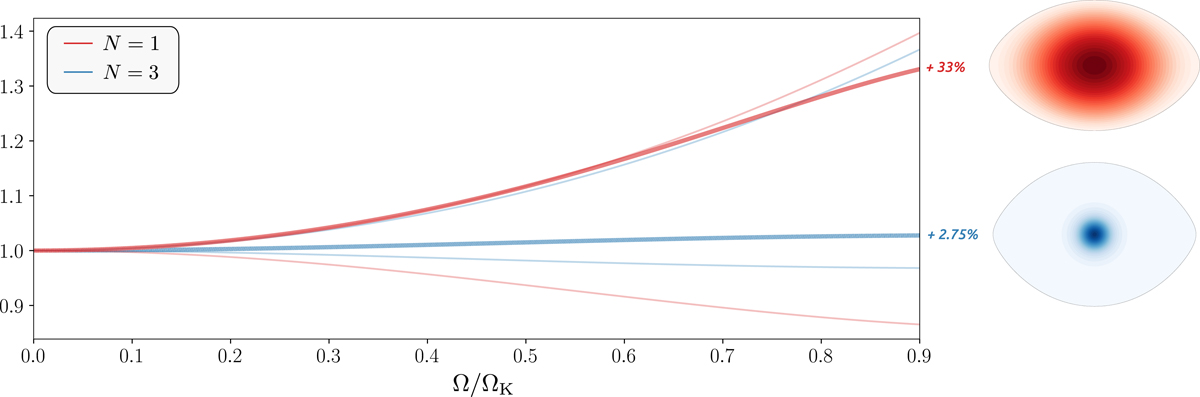
Mass growth in polytropes of indices N = 1 (red curves) and N = 3 (blue curves) as a function of the normalised rotation rate in the case of solid rotation. The upper and lower thin curves represent the equatorial and polar radii in both polytropes, respectively, and the thicker curves indicate their mass. All quantities are expressed in units of the non-rotating models’ parameters, and the percentages on the right side give the relative mass increase at Ω = 0.9ΩK with ![]() , the Keplerian rotation rate. The colour maps adjoining the curves depict the mass distribution in both models after deformation at Ω = 0.9ΩK.
, the Keplerian rotation rate. The colour maps adjoining the curves depict the mass distribution in both models after deformation at Ω = 0.9ΩK.
Current usage metrics show cumulative count of Article Views (full-text article views including HTML views, PDF and ePub downloads, according to the available data) and Abstracts Views on Vision4Press platform.
Data correspond to usage on the plateform after 2015. The current usage metrics is available 48-96 hours after online publication and is updated daily on week days.
Initial download of the metrics may take a while.