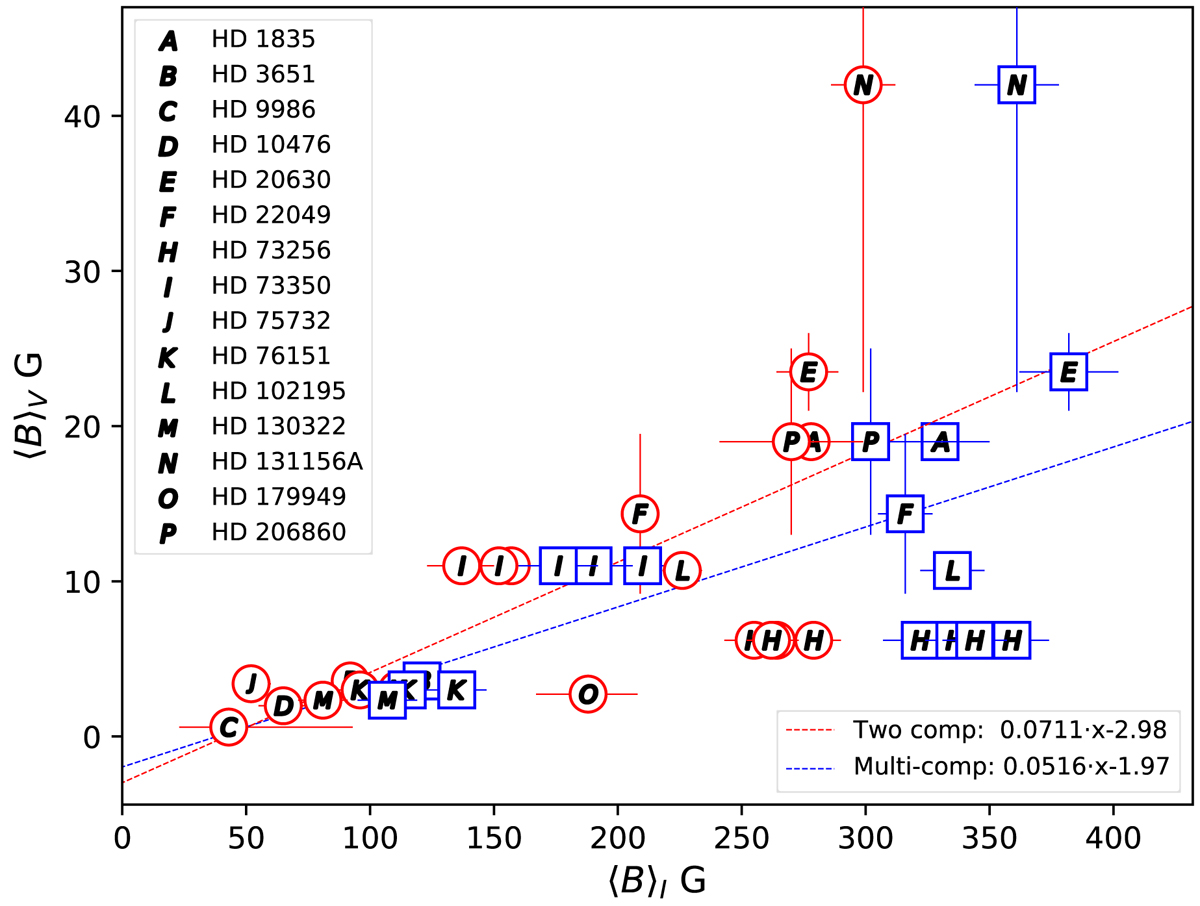
Fig. 6.
Download original image
Mean strengths of the large- and small-scale fields from Tables 1 and 3, respectively. The red circles represent the two-component results. The blue squares represent multi-component results that are significantly different compared to their two-component counterpart. The dashed lines show linear fits, red for the two-component model and blue for the multi-component model. Uncertainties in ⟨B⟩V represent scatter in the ZDI results corresponding to different observing epochs. Stellar labels are the same as in Fig. 5.
Current usage metrics show cumulative count of Article Views (full-text article views including HTML views, PDF and ePub downloads, according to the available data) and Abstracts Views on Vision4Press platform.
Data correspond to usage on the plateform after 2015. The current usage metrics is available 48-96 hours after online publication and is updated daily on week days.
Initial download of the metrics may take a while.