Fig. 2
Download original image
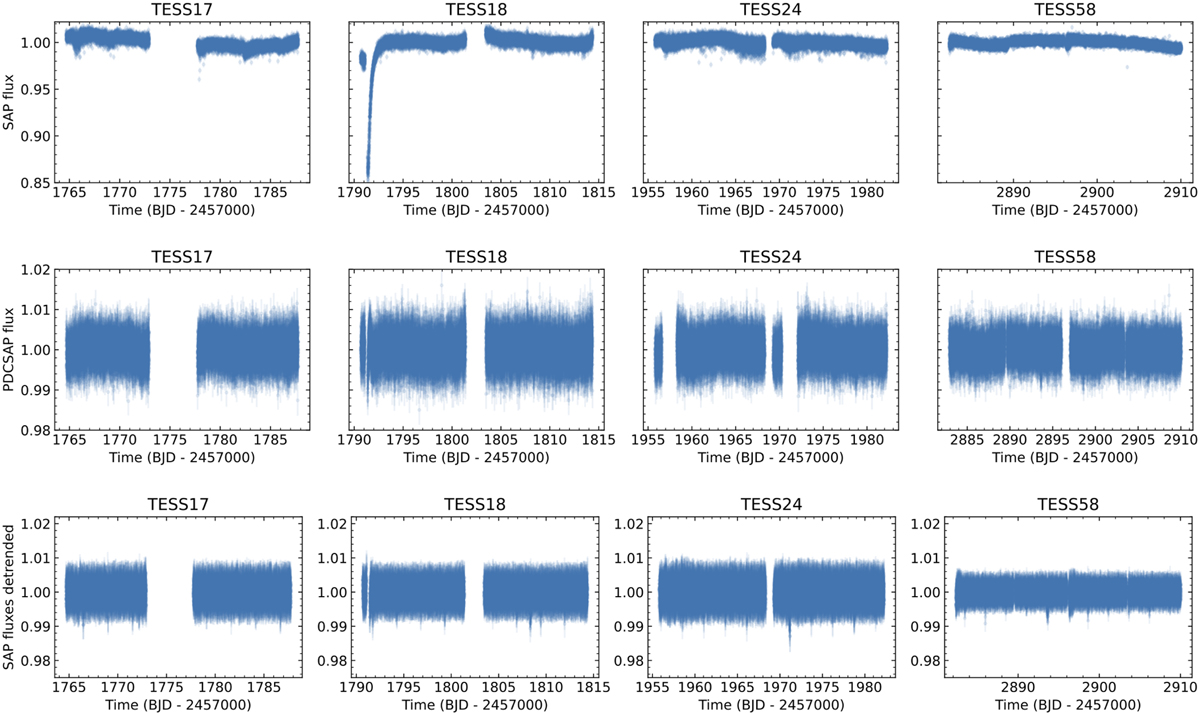
TESS LCs. Upper and middle panels: SAP and PDCSAP light curves (blue dots) of TOI-1470 as obtained by TESS in sectors 17, 18, 24, and 58, and processed by SPOC (left to right). Lower panels: SAP fluxes detrended and cleaned from outliers by us (blue dots) and used in our final planetary analysis. The transit features have been masked for the detrending.
Current usage metrics show cumulative count of Article Views (full-text article views including HTML views, PDF and ePub downloads, according to the available data) and Abstracts Views on Vision4Press platform.
Data correspond to usage on the plateform after 2015. The current usage metrics is available 48-96 hours after online publication and is updated daily on week days.
Initial download of the metrics may take a while.