Fig. 15
Download original image
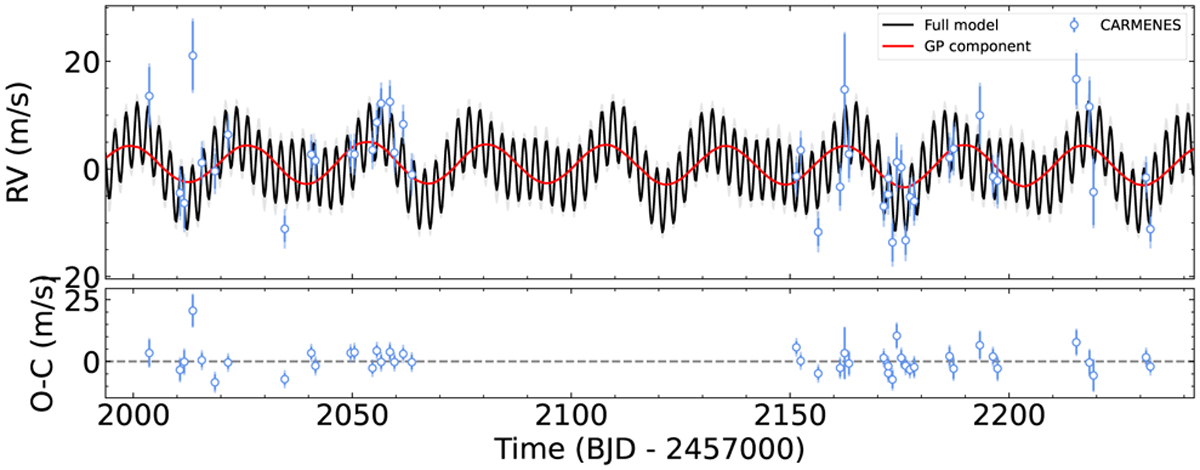
TOI-1470 CARMENES RVs (blue dots) and the best model (black line) with its lσ confidence level (gray shaded area) obtained from the combined photometric and spectroscopic fit. The top panel shows the entire RV time series as a function of the time. The red line shows the GP component that models the stellar activity. The bottom panel shows the RV residuals after subtracting the full model. All error bars include the quoted CARMENES uncertainties and the RV jitter as obtained from the model added in quadrature.
Current usage metrics show cumulative count of Article Views (full-text article views including HTML views, PDF and ePub downloads, according to the available data) and Abstracts Views on Vision4Press platform.
Data correspond to usage on the plateform after 2015. The current usage metrics is available 48-96 hours after online publication and is updated daily on week days.
Initial download of the metrics may take a while.