Fig. 11
Download original image
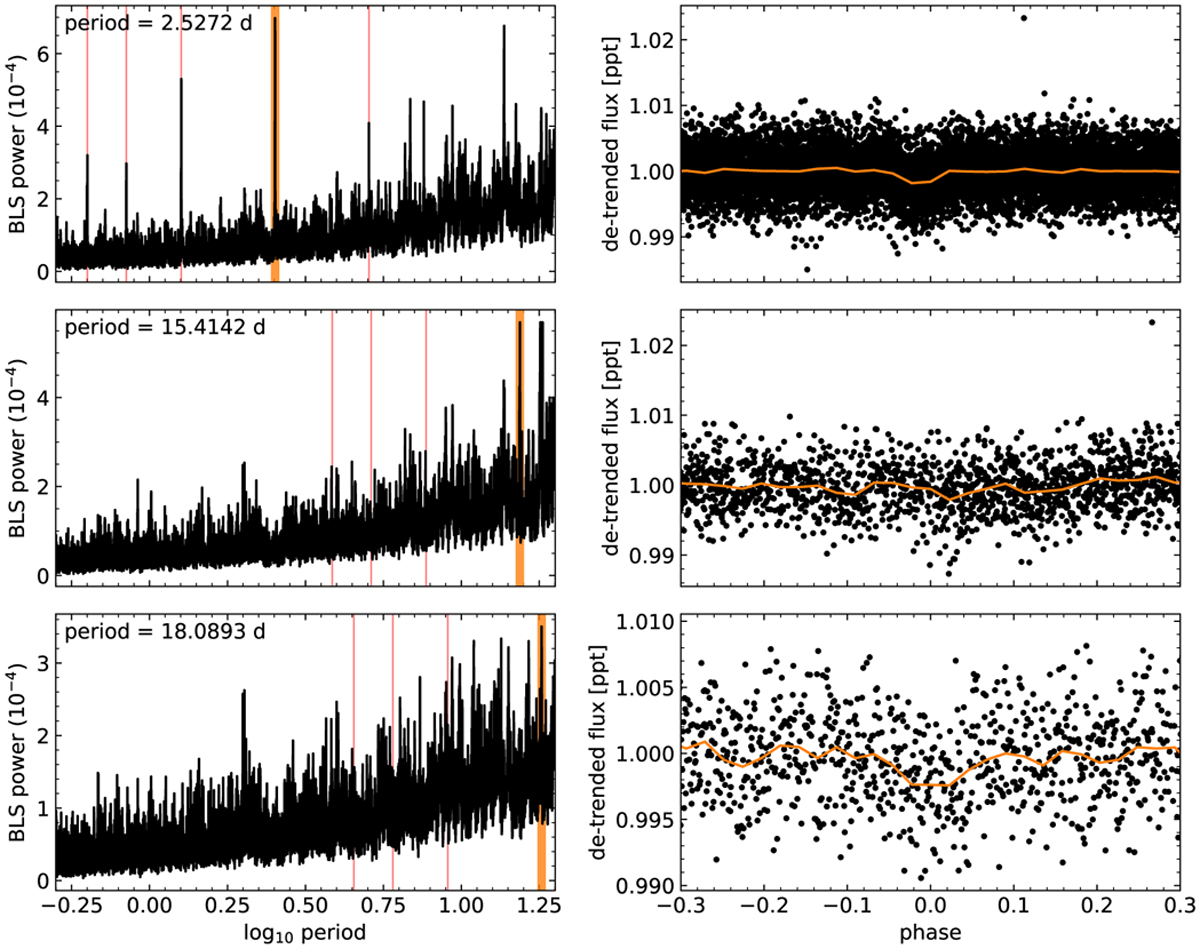
BLS periodograms of TESS sectors 17, 18, and 24 (left panels) and the photometric data folded in phase (right panels), together with a roughly binned (orange line). Various harmonics are also identified with vertical thin red lines. Top panel: detection of the 2.52 d transiting planet (the strongest peak is marked with a vertical orange line). Middle panel: detection of a potential 15.41 d signal after masking the previous signal. The LC folded in phase does not show any evidence of a transit. Bottom panel: detection of the 18.08 d transiting-planet candidate (strongest peak) after masking the two previous signals. The LC data folded in phase appear to indicate a possible shallow transit.
Current usage metrics show cumulative count of Article Views (full-text article views including HTML views, PDF and ePub downloads, according to the available data) and Abstracts Views on Vision4Press platform.
Data correspond to usage on the plateform after 2015. The current usage metrics is available 48-96 hours after online publication and is updated daily on week days.
Initial download of the metrics may take a while.