Fig. 8
Download original image
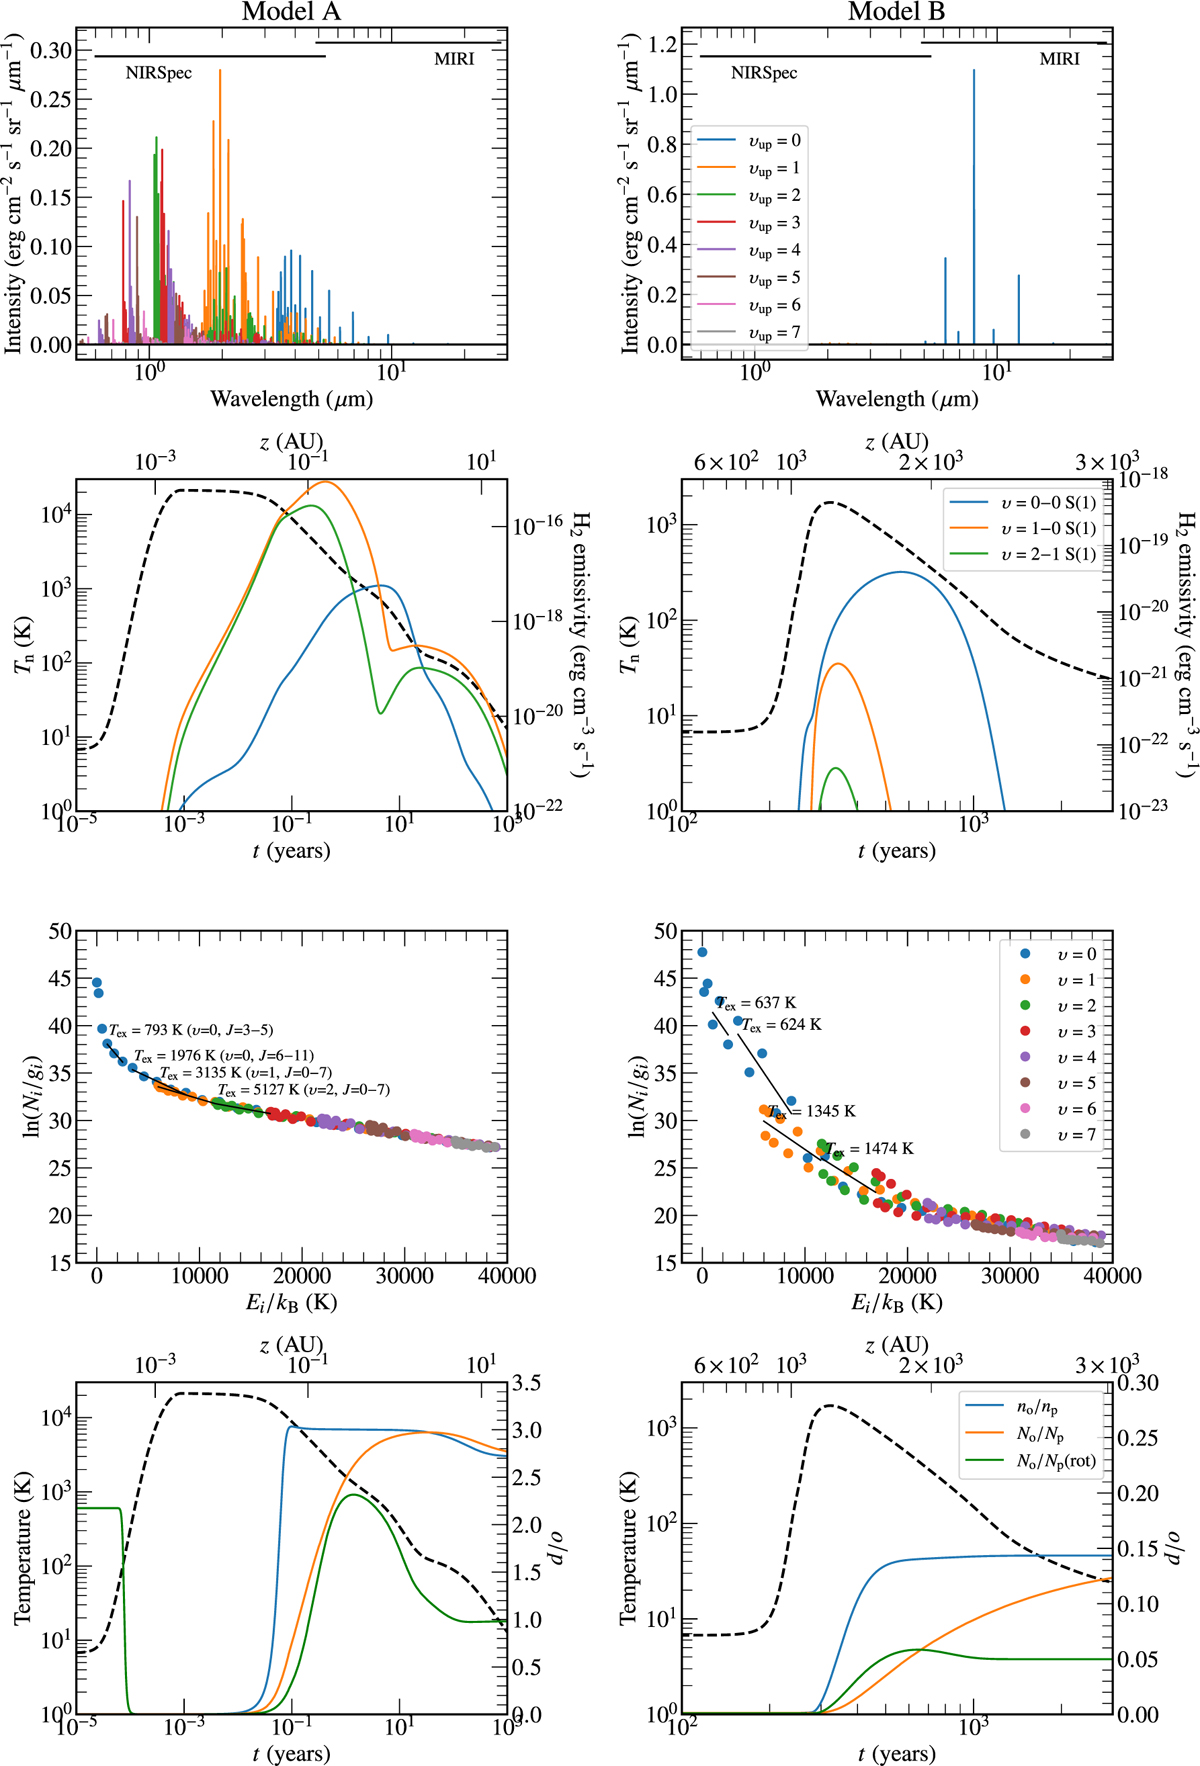
Top row: resulting H2 spectrum in model A and B (Table 3). The wavelength ranges of NIRSpec and MIRI on the JWST are labeled. The resolving power is uniform across the spectrum, implying that the linewidths increase with wavelength (not visible on this plot). Second row: H2 emissivities for three lines. The temperature profile is shown in black. Third row: H2 excitation diagrams color-coded according to vibrational level, and with four extracted excitation temperatures shown. The excitation temperatures are obtained from a linear fit to all the indicated levels. Fourth row: o/p ratio measured from local densities (no/np), cumulative column densities (No/Np), and from the column densities of the υup = 0, J = 2–9 levels (No/Np(rot)).
Current usage metrics show cumulative count of Article Views (full-text article views including HTML views, PDF and ePub downloads, according to the available data) and Abstracts Views on Vision4Press platform.
Data correspond to usage on the plateform after 2015. The current usage metrics is available 48-96 hours after online publication and is updated daily on week days.
Initial download of the metrics may take a while.