Fig. 5
Download original image
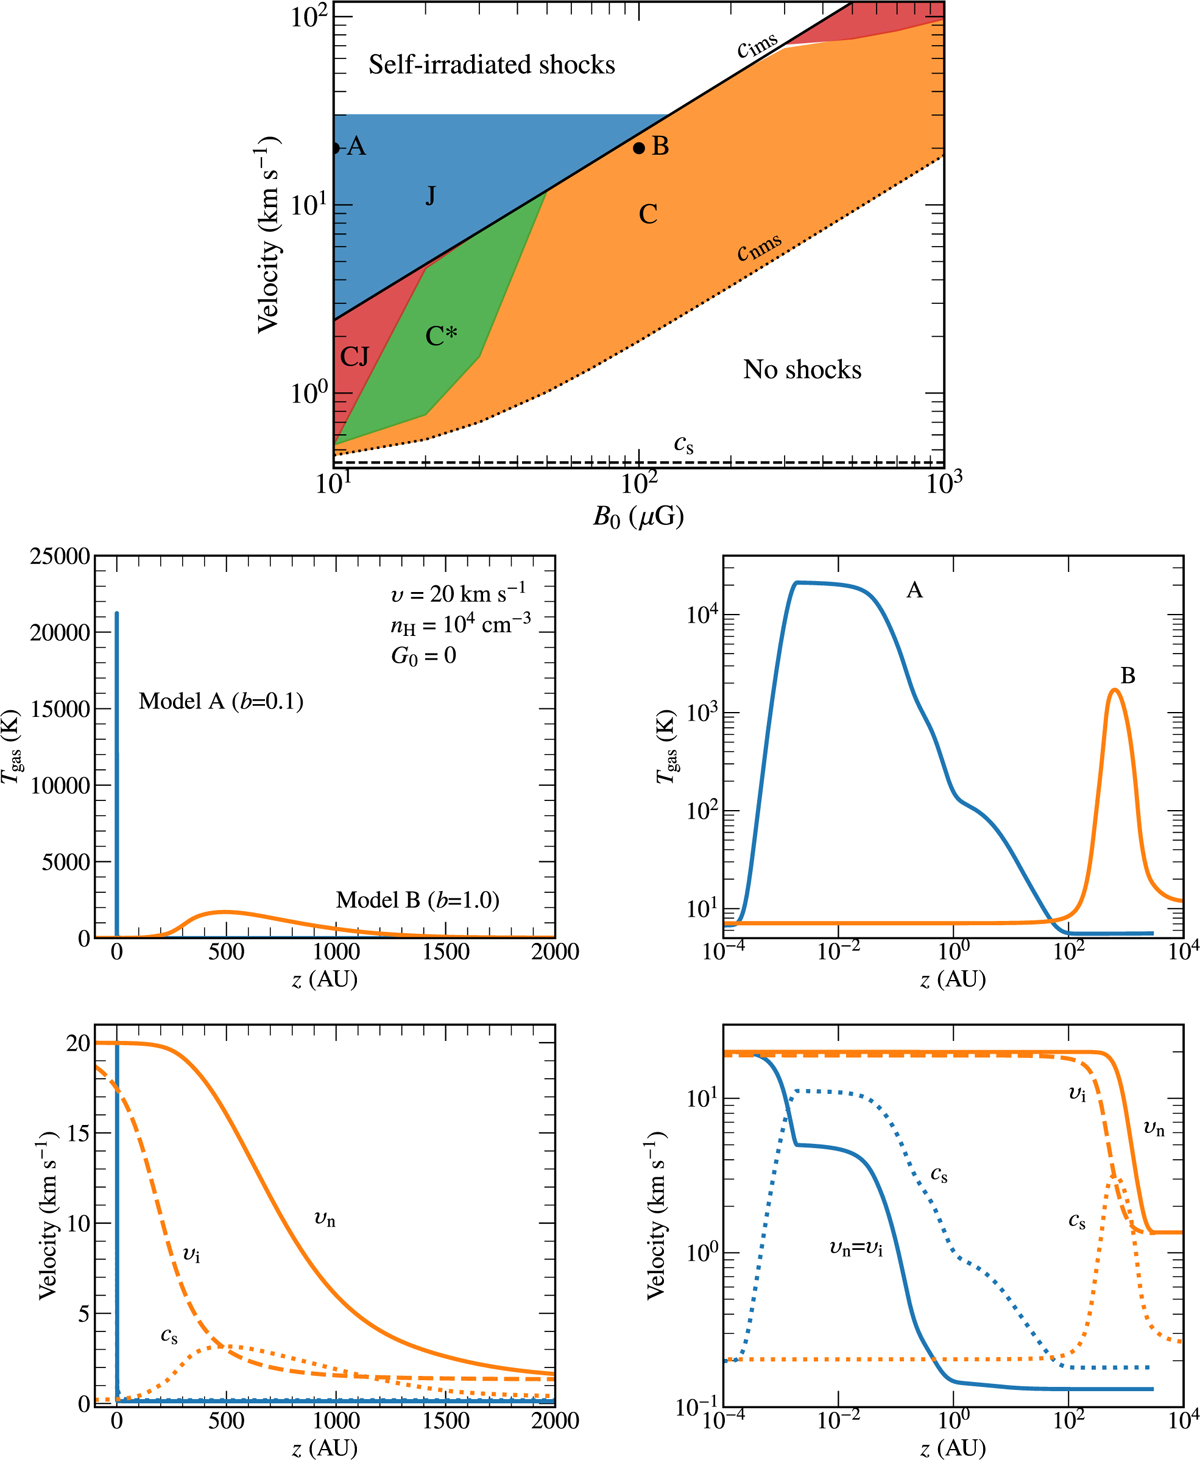
Illustration of shock parameter space. Top: various shock type regimes as a function of transverse magnetic field strength and shock velocity for G0 = 0 and preshock density of 104 cm−3 (adapted from Fig. 3, Godard et al. 2019). Here a field strength of 10 µG corresponds to b = 0.1, and 103 µG is b = 10. The blue region is for J-type shocks where the velocity exceeds the ion-magnetosonic velocity (cims). Above 30 km s−1 the shocks start producing UV-photons and become self-irradiated, which is not included in the current grid (Lehmann et al. 2022). The red, green and orange areas are for CJ, C*, and C-type shocks, respectively; these shocks fall between the ion- and neutral-magnetosonic velocities (cims and cnms, where the latter is calculated in a similar manner to cims, Eq. (2), but with the neutral mass density). Models A and B are marked. Middle: gas temperature profiles for models A and B. Bottom: velocity profiles for models A and B. The dotted line shows the local sound speed, cs, the dashed is for the ion speed, υi, and the full is for the neutral speed, υn. All velocities are in the reference frame of the shock, and the line colors are for the same b parameters as above. The difference between the left- and right-hand sides of the middle and bottom panels is that the left panel is on a linear-linear scale, while the right is on a log-log scale.
Current usage metrics show cumulative count of Article Views (full-text article views including HTML views, PDF and ePub downloads, according to the available data) and Abstracts Views on Vision4Press platform.
Data correspond to usage on the plateform after 2015. The current usage metrics is available 48-96 hours after online publication and is updated daily on week days.
Initial download of the metrics may take a while.