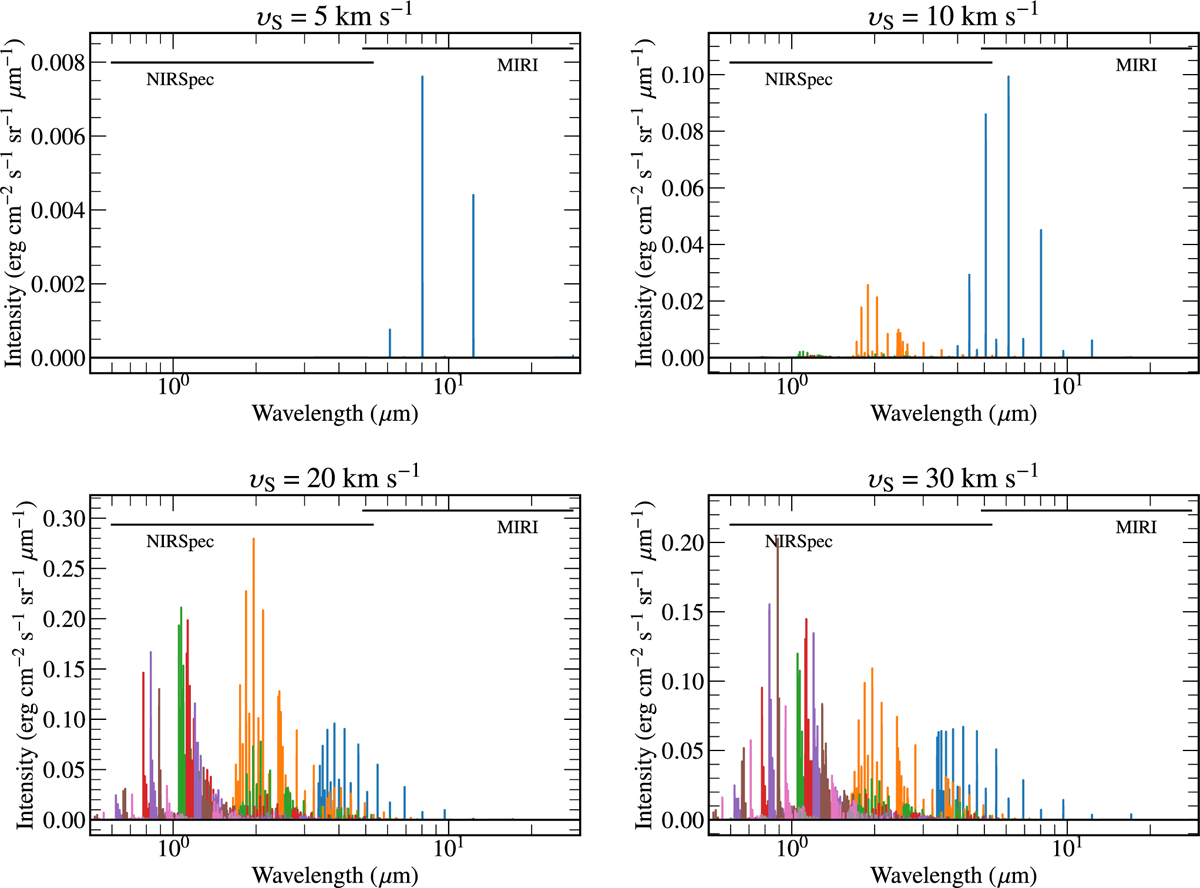
Fig. 10
Download original image
H2 spectra for velocities of 5, 10, 20, and 30 km s−1 and a density of 104 cm−3, b = 0.1, G0 = 0; the shock with υS = 20 km s−1 is model A, and the 30 km-s−1 shock is shown in Fig. 1. The colors are for different vibrational levels as in Fig. 8. The complete coverage of NIRSpec and MIRI are shown; we refer to Fig. 1 for the NIRCam and MIRI filter coverage.
Current usage metrics show cumulative count of Article Views (full-text article views including HTML views, PDF and ePub downloads, according to the available data) and Abstracts Views on Vision4Press platform.
Data correspond to usage on the plateform after 2015. The current usage metrics is available 48-96 hours after online publication and is updated daily on week days.
Initial download of the metrics may take a while.