Open Access
Fig. 4
Download original image
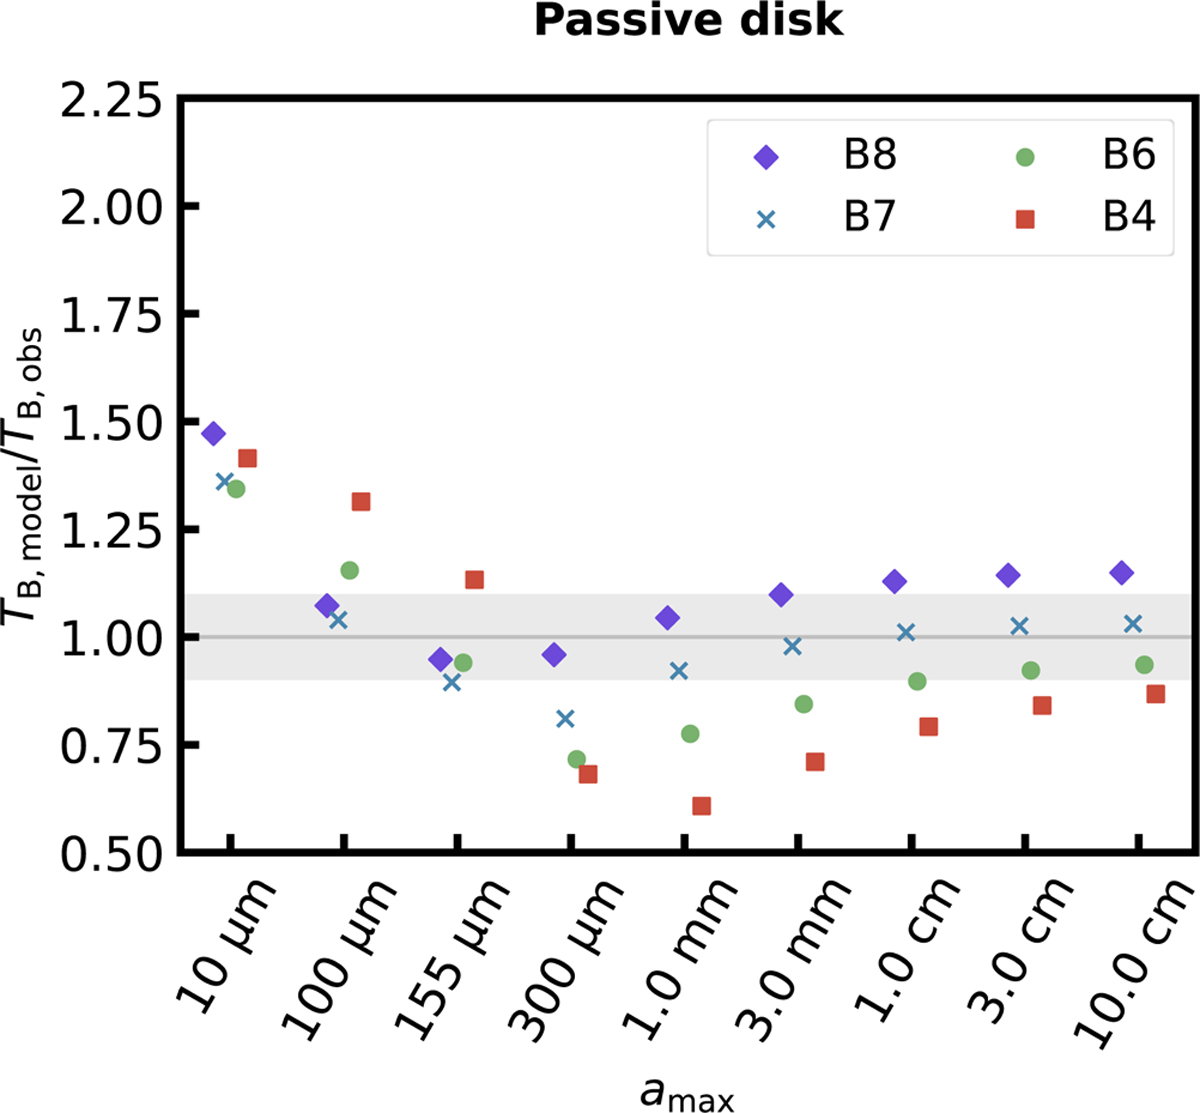
Brightness temperature at the center of model images normalized by the observed brightness temperature. The gray shaded region denotes the region where the model explains the observations with an accuracy of 10%, which is the typical ALMA calibration uncertainty.
Current usage metrics show cumulative count of Article Views (full-text article views including HTML views, PDF and ePub downloads, according to the available data) and Abstracts Views on Vision4Press platform.
Data correspond to usage on the plateform after 2015. The current usage metrics is available 48-96 hours after online publication and is updated daily on week days.
Initial download of the metrics may take a while.