Fig. 8
Download original image
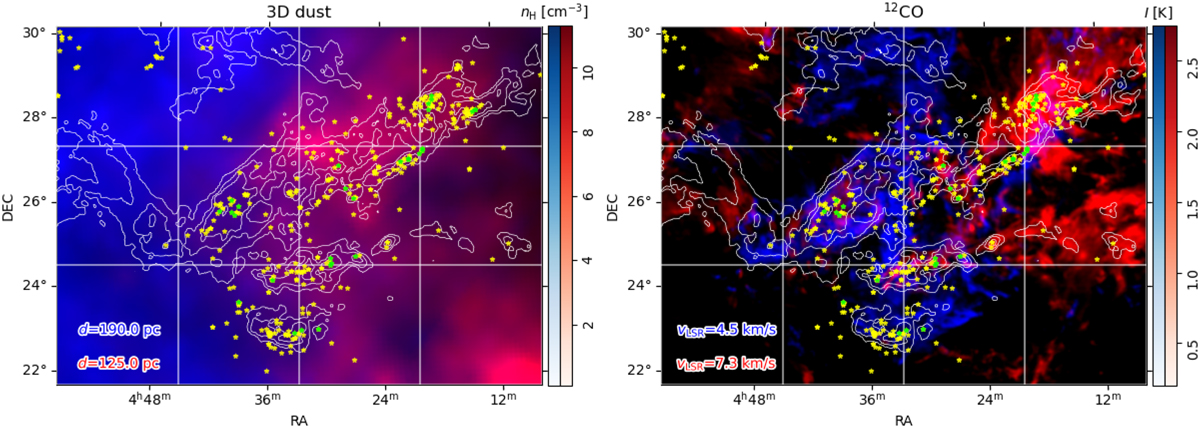
Distribution of the hydrogen volume density (nH) derived from the Leike et al. (2020) 3D dust reconstruction (left) and 12CO emission (right) for the minimum and maximum distance and radial velocity channels with significant correlation, identified by the red and blue crosses in Fig. 4. The maps shown in a blue colormap correspond to the farthest distance and the lowest velocity channels with V > 3ςv, where ςv is the standard deviation of V across the whole distance and velocity range. The maps shown in a red colormap correspond to the nearest distance and the highest velocity channels with V > 3ςv. The yellow and green stars indicate the positions of the young (age < 10 Myr) stellar objects presented in Galli et al. (2019) and young stellar clusters in Luhman (2023), respectively.
Current usage metrics show cumulative count of Article Views (full-text article views including HTML views, PDF and ePub downloads, according to the available data) and Abstracts Views on Vision4Press platform.
Data correspond to usage on the plateform after 2015. The current usage metrics is available 48-96 hours after online publication and is updated daily on week days.
Initial download of the metrics may take a while.