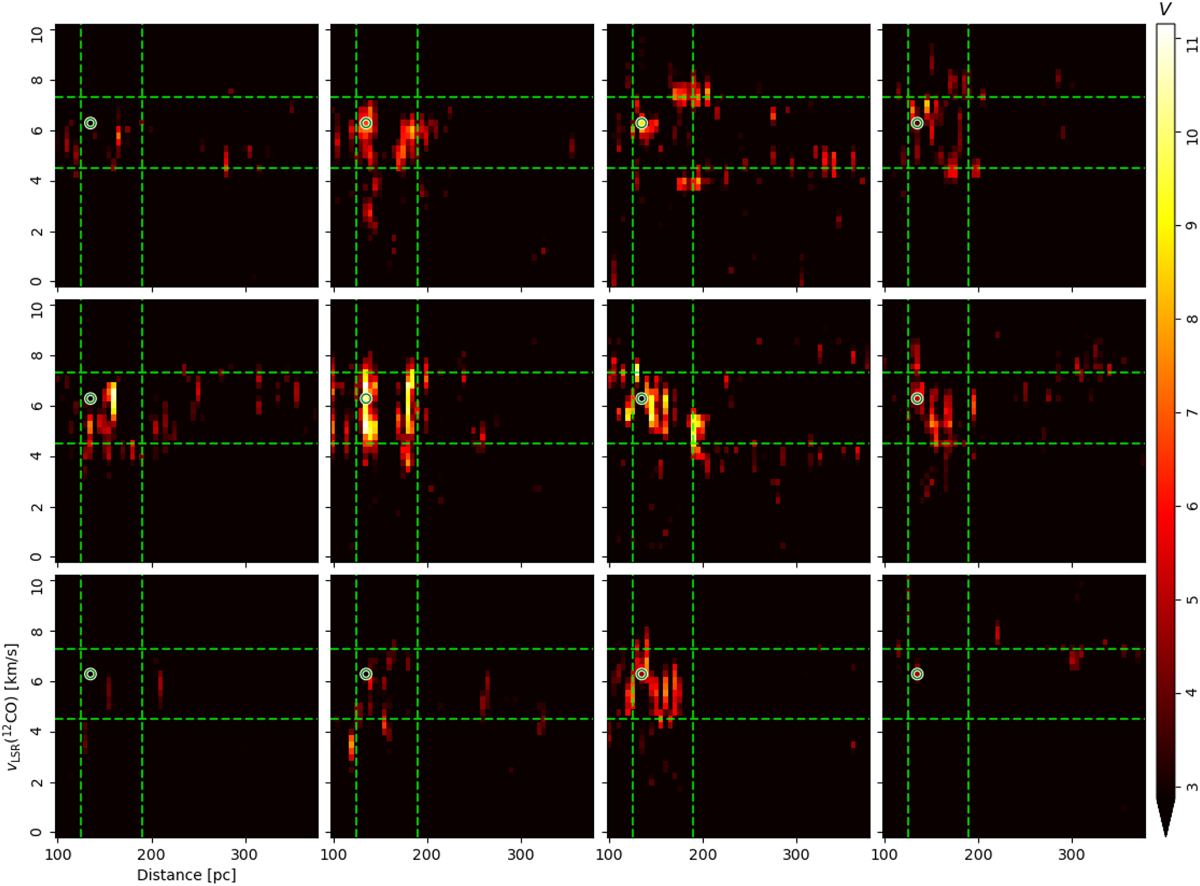
Fig. 7
Download original image
Correlation between the distribution of the hydrogen volume density (nH) derived from the Leike et al. (2020) 3D dust reconstruction and 12CO emission across distances and radial velocities as quantified by the projected Rayleigh statistic (V) for the 4 × 3 regions shown in Fig. 6. The vertical and horizontal dashed lines correspond to the distances and radial velocity ranges defined in Fig. 4. The circle marks the pair of distance and velocity channels with the highest global V, which are presented in Fig. 6.
Current usage metrics show cumulative count of Article Views (full-text article views including HTML views, PDF and ePub downloads, according to the available data) and Abstracts Views on Vision4Press platform.
Data correspond to usage on the plateform after 2015. The current usage metrics is available 48-96 hours after online publication and is updated daily on week days.
Initial download of the metrics may take a while.