Fig. 5
Download original image
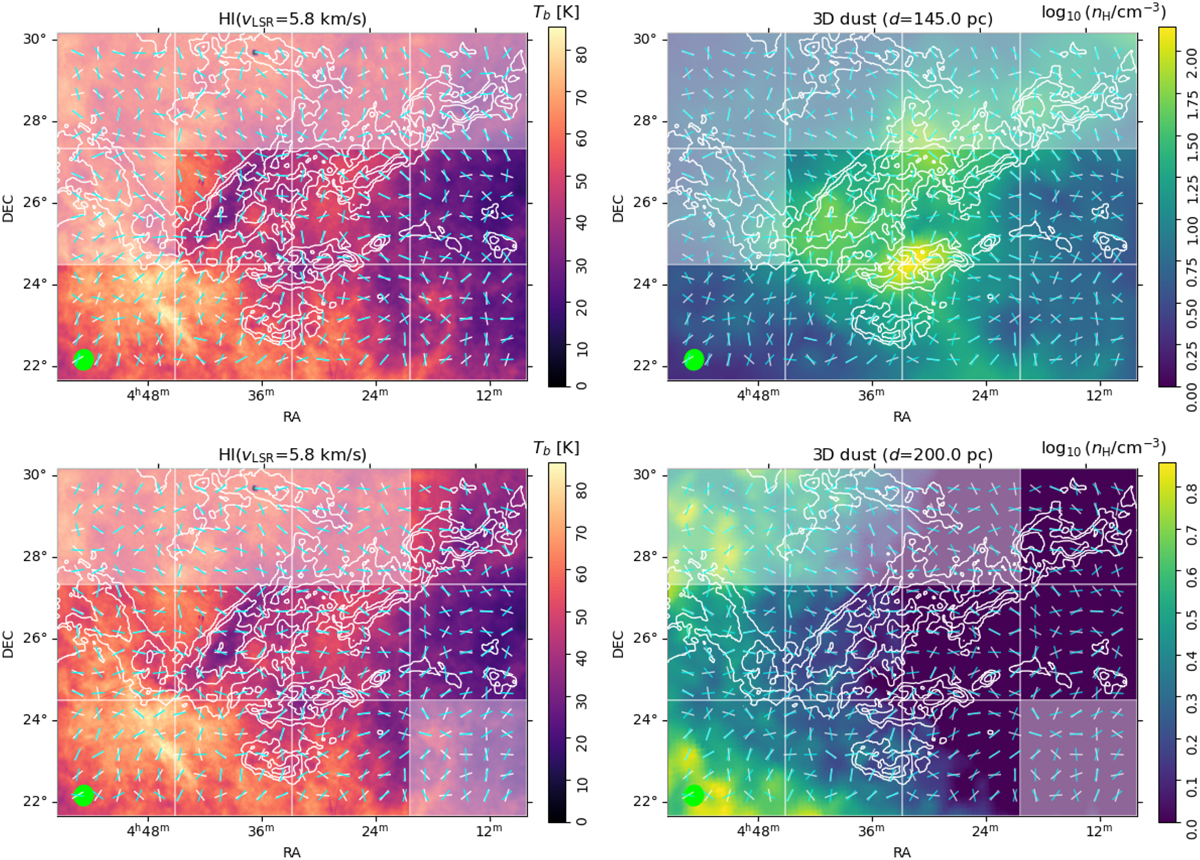
Atomic hydrogen (H I) emission and distribution of the hydrogen volume density (nH) derived from the Leike et al. (2020) 3D dust reconstruction for two radial velocity and distance channels with the highest V, as indicated in Fig. 4. The pseudovectors indicate the orientation of the Tb and nH gradients, shown in white and cyan colors respectively. The translucent mask marks the blocks where V < 2.87, thus indicating areas of negligible morphological correlation.
Current usage metrics show cumulative count of Article Views (full-text article views including HTML views, PDF and ePub downloads, according to the available data) and Abstracts Views on Vision4Press platform.
Data correspond to usage on the plateform after 2015. The current usage metrics is available 48-96 hours after online publication and is updated daily on week days.
Initial download of the metrics may take a while.