Fig. 3
Download original image
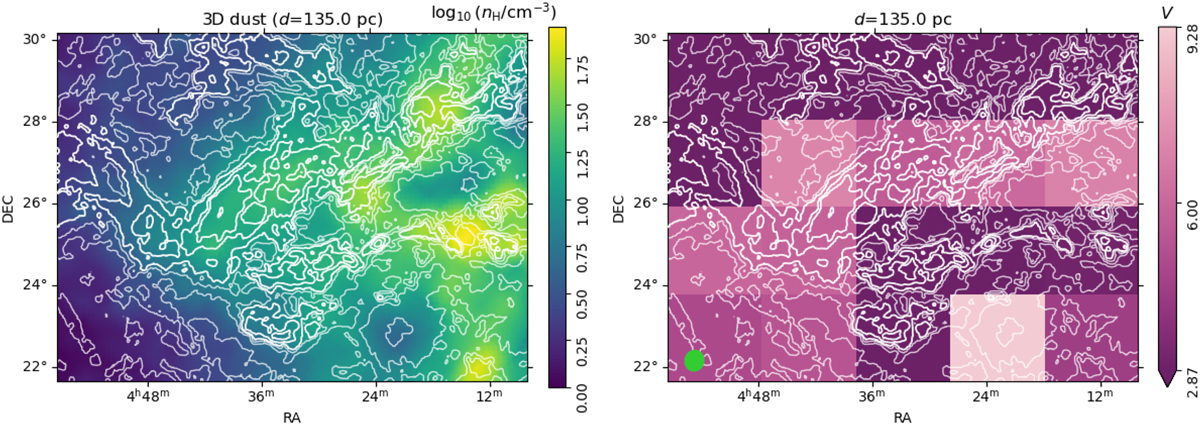
Left: Distribution of the hydrogen volume density (nH), derived from the Leike et al. (2020) 3D dust reconstruction, for the distance channel that shows the highest correlation with the gas column density (NH) derived from the Planck observations, shown by the contours. The white contours correspond to NH = 1, 2, 3, 4, 5, 8, and 12.5 × 1021 cm−2. Right: Distribution of the projected Rayleigh statistic (V, Eq. (4)) in 5 × 4 blocks across the map. The minimum of the color bar is set to 2.87, which is roughly equivalent to a 3σ significance for this indicator of the correlation between the two images. The green disk indicates the derivative kernel size Δ = 30′.
Current usage metrics show cumulative count of Article Views (full-text article views including HTML views, PDF and ePub downloads, according to the available data) and Abstracts Views on Vision4Press platform.
Data correspond to usage on the plateform after 2015. The current usage metrics is available 48-96 hours after online publication and is updated daily on week days.
Initial download of the metrics may take a while.