Fig. 2
Download original image
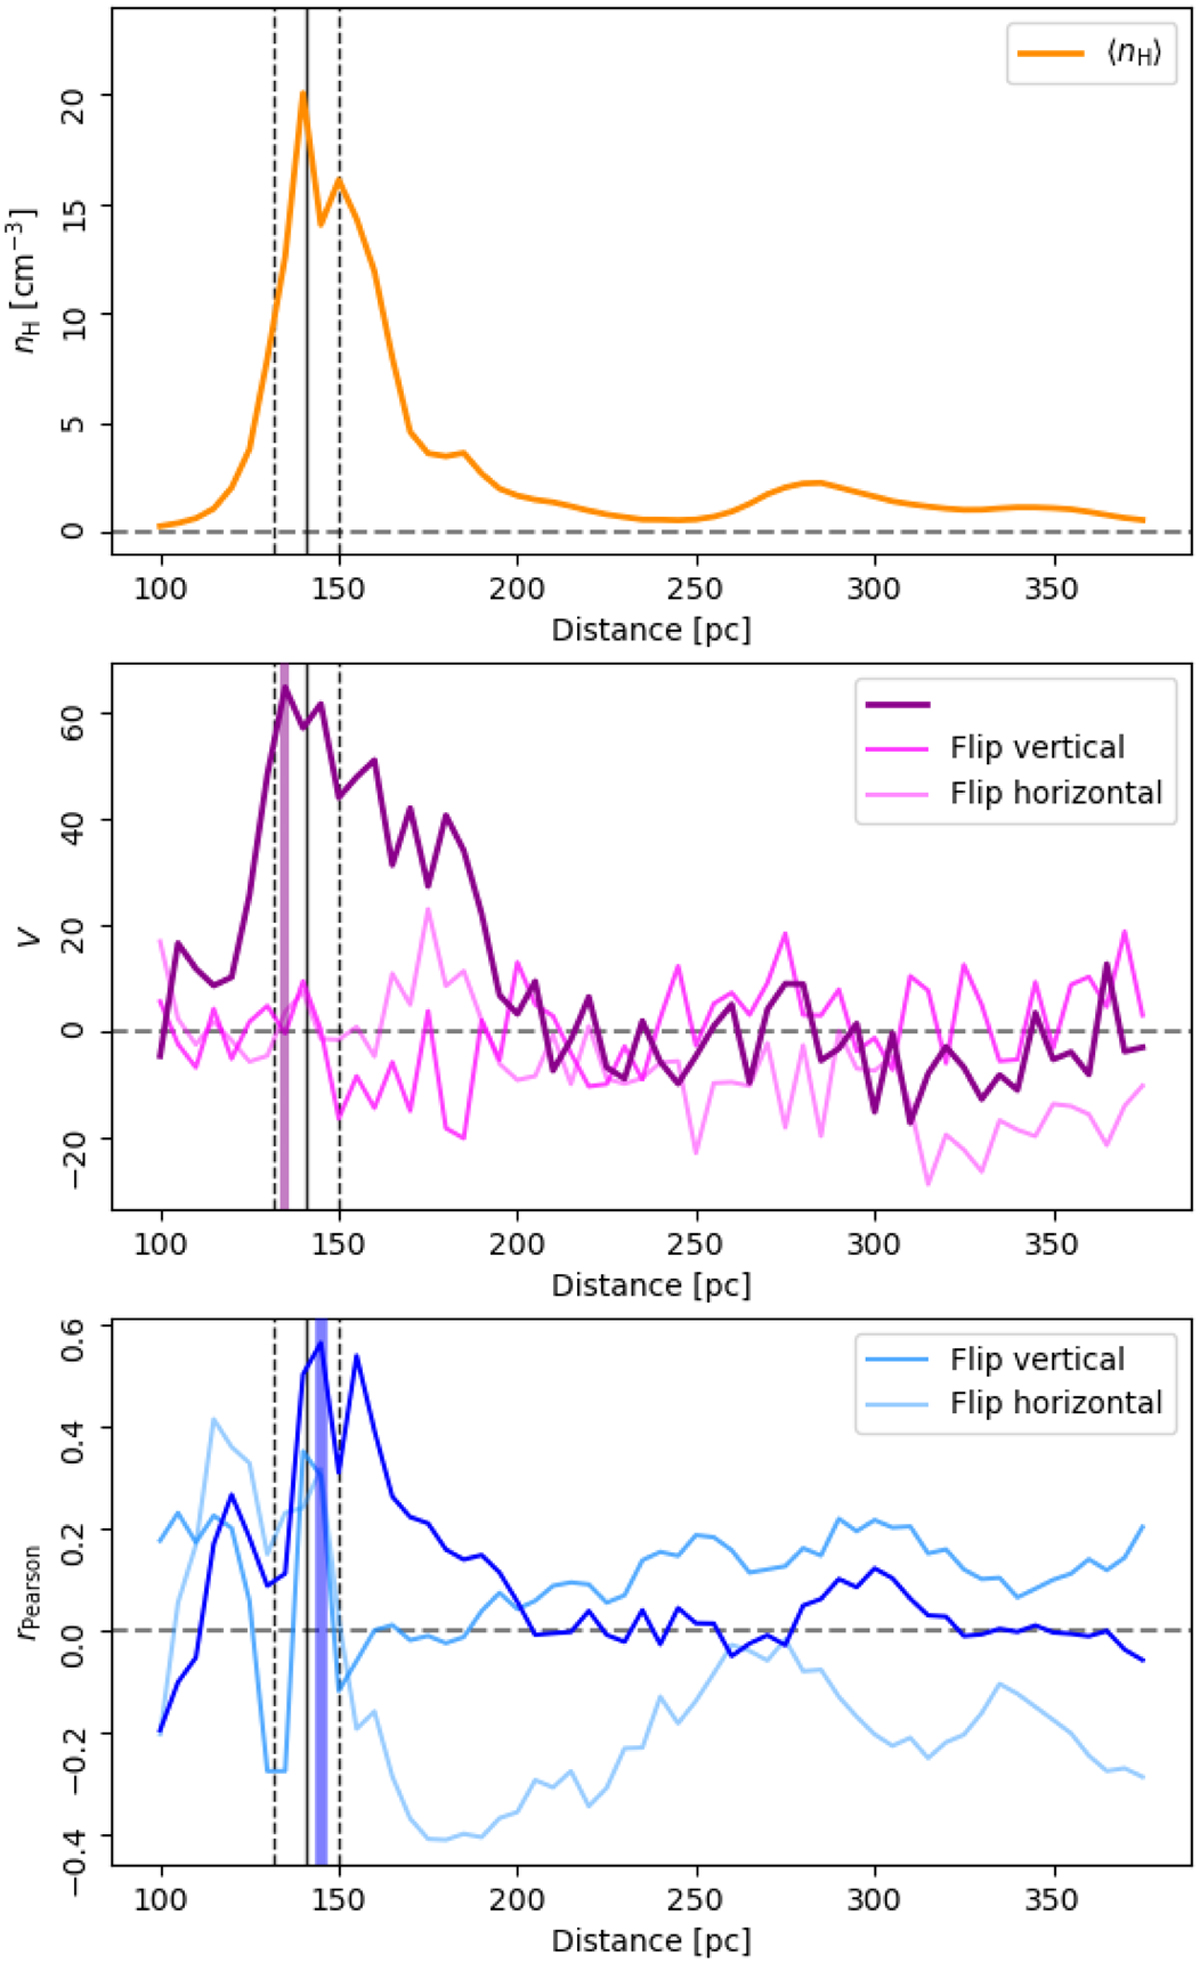
Properties derived from the 3D dust mapping toward the Taurus molecular cloud. Top: Mean volume density of hydrogen nuclei (nH) calculated using Eq. (1). Middle: Projected Rayleigh statistic (V, Eq. (4)) for the integrated dust column density derived from the Planck observations (NH) and the distribution of dust across distance slices in the 3D dust reconstruction. Values of V ≈ 0 correspond to a random orientation between the gradients of the two tracers, thus indicating low morphological correlation. Values of V > 2.87 correspond to the mostly parallel gradient, thus indicating a significant morphological correlation. Bottom: Pearson correlation coefficient (rPearson) between NH and the distribution of dust across distance slices. The solid colored vertical line indicates the distance channel with the maximum V. The faint lines correspond to the chance correlation tests performed by flipping the maps with respect to each other in the vertical and horizontal directions. The black vertical lines indicate the average distance to the Taurus MC and its corresponding confidence interval, as reported in Zucker et al. (2020).
Current usage metrics show cumulative count of Article Views (full-text article views including HTML views, PDF and ePub downloads, according to the available data) and Abstracts Views on Vision4Press platform.
Data correspond to usage on the plateform after 2015. The current usage metrics is available 48-96 hours after online publication and is updated daily on week days.
Initial download of the metrics may take a while.