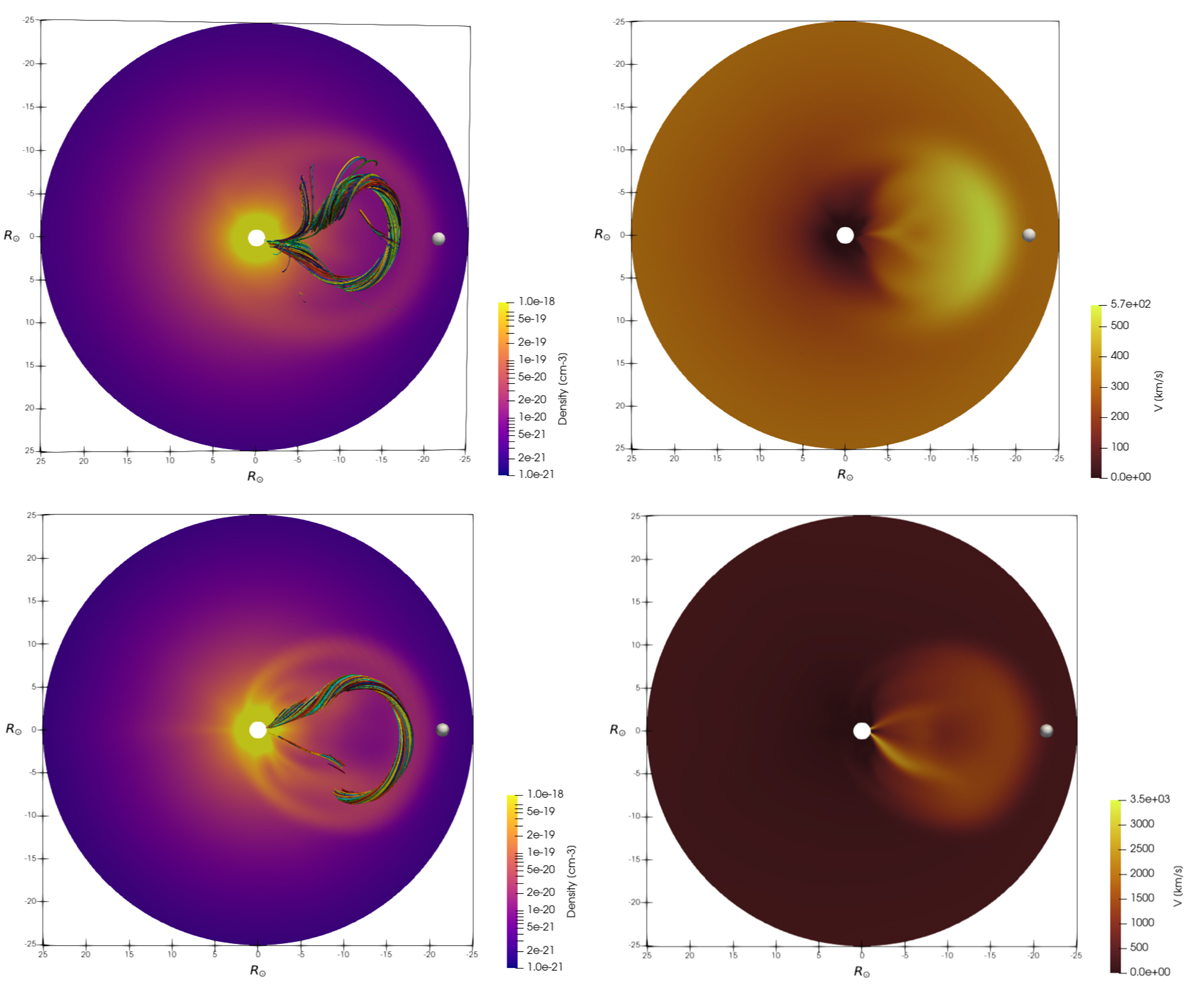
Fig. 8.
Download original image
Cross-sections along the equatorial plane of the density in log scale (left column) and of the radial velocity (right column). The top panels show the flux rope with ζ = 15 evolving in the minimum activity configuration, while the bottom panels correspond to the simulation with ζ = 9 in the maximum activity scenario. In the density panels, some magnetic field lines crossing a sphere of radius 1.5 R⊙ located at x = −16 R⊙ are also displayed. Each color corresponds to one field line. A virtual satellite was placed at 21.5 R⊙ (X = −21.5 R⊙, Y = 0, Z = 0) and is shown as a white sphere. The shape of the sheath is delimited by an ellipse in the density panels. In both solar wind configurations, a sheath is ahead of the flux rope, which is consistent with the observations. When the initial speed of the flux ropes is too high, there are nonphysical high-speed streams in the wake of flux rope legs.
Current usage metrics show cumulative count of Article Views (full-text article views including HTML views, PDF and ePub downloads, according to the available data) and Abstracts Views on Vision4Press platform.
Data correspond to usage on the plateform after 2015. The current usage metrics is available 48-96 hours after online publication and is updated daily on week days.
Initial download of the metrics may take a while.