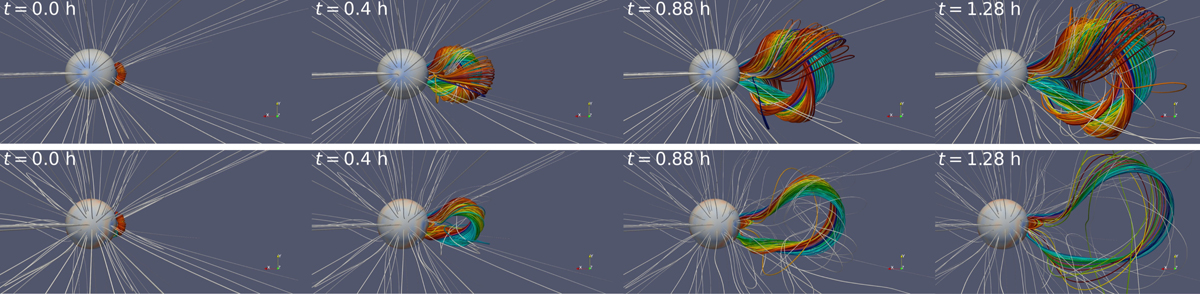
Fig. 7.
Download original image
Visualization of the propagation of the TDm model in the solar wind reconstructed from a minimum of activity (top row) and from a maximum of activity (bottom row). For the two magnetic configurations, snapshots were taken at the beginning of the simulation and at physical times equal to 0.4 h, 0.88 h, and 1.28 h. The color legend is the same as in Fig. 4. The geometry of the flux ropes evolving in the maximum activity configuration is not identical to the one observed in the minimum activity scenario, meaning the solar wind configuration has an impact on the geometrical properties.
Current usage metrics show cumulative count of Article Views (full-text article views including HTML views, PDF and ePub downloads, according to the available data) and Abstracts Views on Vision4Press platform.
Data correspond to usage on the plateform after 2015. The current usage metrics is available 48-96 hours after online publication and is updated daily on week days.
Initial download of the metrics may take a while.