Fig. 5.
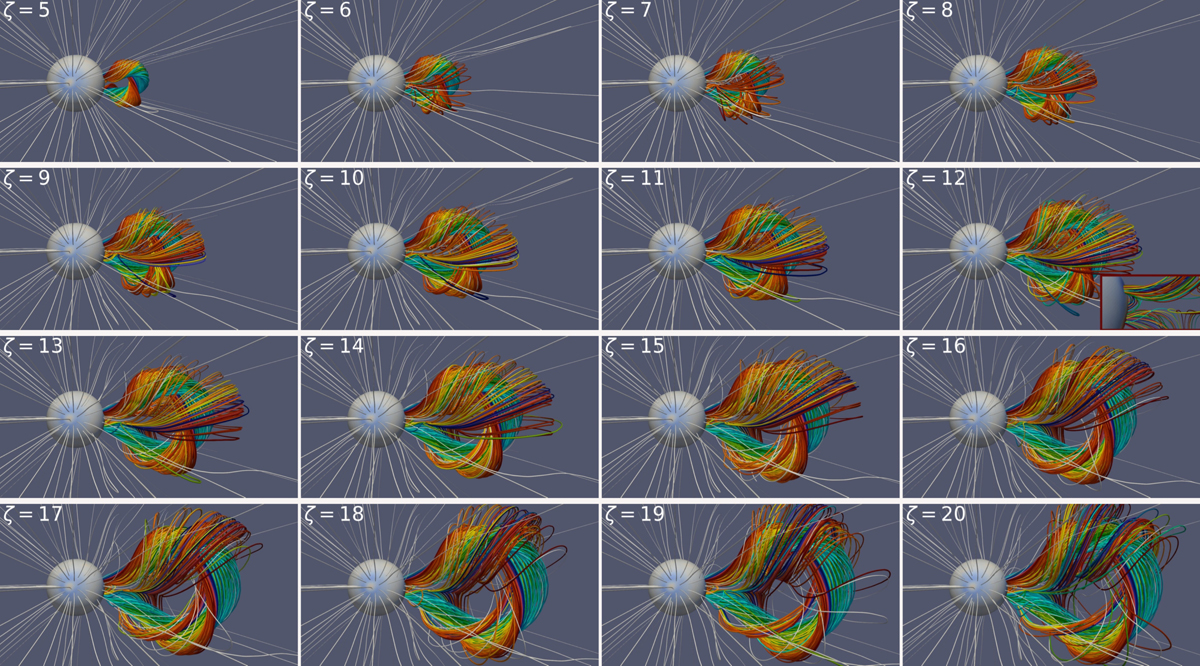
Download original image
Visualization of all the flux ropes modeled in the solar wind reconstructed from a minimum of activity at the physical time t = 1.2 h. The magnetic field lines are displayed according to the legend presented in Fig. 4. The small panel in the bottom-right corner of the simulation labeled “ζ = 12” is a zoom in on the polarities, and it highlights the presence of post-flare loops.
Current usage metrics show cumulative count of Article Views (full-text article views including HTML views, PDF and ePub downloads, according to the available data) and Abstracts Views on Vision4Press platform.
Data correspond to usage on the plateform after 2015. The current usage metrics is available 48-96 hours after online publication and is updated daily on week days.
Initial download of the metrics may take a while.