Fig. 2.
Download original image
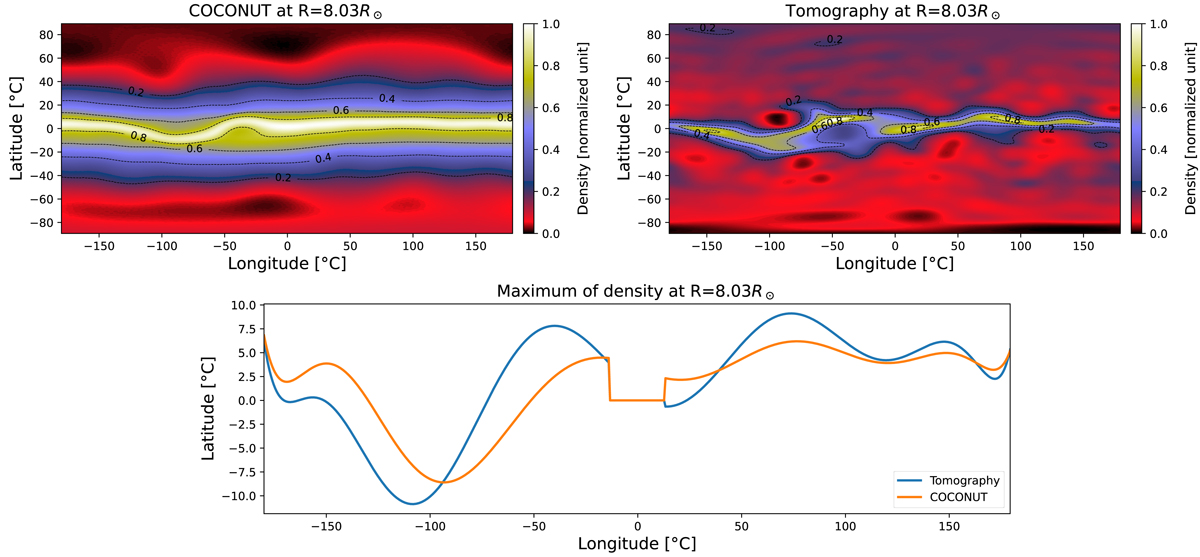
Comparison of the density values derived from COCONUT and those obtained through the tomographic process. Top panels: density maps of the solar corona at height R = 8.0 R⊙ for the total solar eclipse of 2 July 2019 in Carrington longitude-latitude coordinates. The left panel shows the density extracted from the COCONUT model, and the right panel shows the density obtained from the tomography process detailed in the Sect. 2.2. The color bars correspond to the density in normalized units. The dotted lines delineate isocontours for density values of [0.2, 0.4, 0.6, 0.8]. Bottom panel: position of the maximum of density in Carrington longitude-latitude coordinates. The orange curve is the maximum obtained from the COCONUT model, while the blue curve is the maximum from the tomography data. The position of the equatorial streamer belt, which has been reconstructed by COCONUT, is consistent with the one obtained by tomography.
Current usage metrics show cumulative count of Article Views (full-text article views including HTML views, PDF and ePub downloads, according to the available data) and Abstracts Views on Vision4Press platform.
Data correspond to usage on the plateform after 2015. The current usage metrics is available 48-96 hours after online publication and is updated daily on week days.
Initial download of the metrics may take a while.