Fig. 13.
Download original image
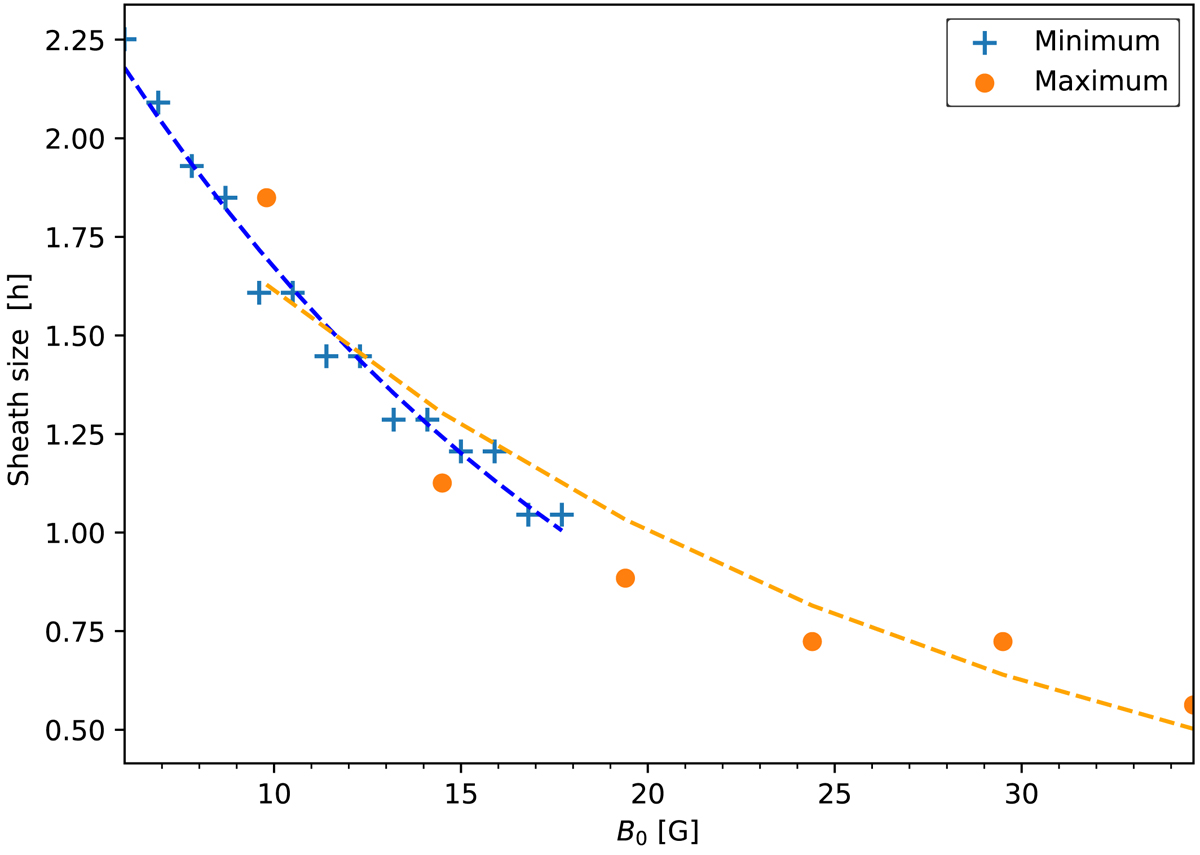
Approximate size of the sheath (in hours) as a function of the initial magnetic field. The orange dots indicate the simulations at the maximum of activity, while the blue markers correspond to simulations at the minimum of activity. The orange and blue lines are exponential curves fitting the data. As expected, the width of the sheath decreases with increasing initial speed.
Current usage metrics show cumulative count of Article Views (full-text article views including HTML views, PDF and ePub downloads, according to the available data) and Abstracts Views on Vision4Press platform.
Data correspond to usage on the plateform after 2015. The current usage metrics is available 48-96 hours after online publication and is updated daily on week days.
Initial download of the metrics may take a while.